
Описание
VWAP (объемно-взвешенная средняя цена) — это торговый ориентир, который рассчитывает среднюю цену актива с учетом объема торгов за определенный период. Он широко используется дневными трейдерами, институциональными инвесторами и алгоритмическими торговыми системами для оценки справедливой стоимости и оптимизации исполнения сделок.
Ключевая формула:
VWAP=∑(Price×Volume)/∑Volume
- Цена = Типичная цена (Максимум + Минимум + Закрытие) / 3 или просто цена закрытия.
- Объем = Объем торгов за каждый период.
2. Зачем использовать VWAP?
Цель:
1)Справочная справедливая стоимость
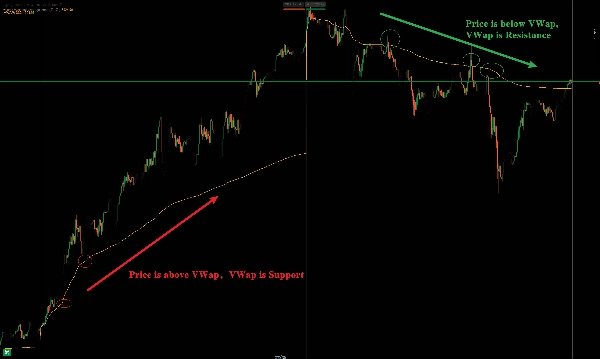
Цена > VWAP = бычий настрой; Цена < VWAP = медвежий настрой.
2)Динамическая поддержка/сопротивление
Служит ключевым уровнем для внутридневных пробоев/разворотов.
3) Подтверждение тренда
Цена удерживается выше VWAP = восходящий тренд; ниже = нисходящий тренд.
Подробное объяснение и применение индикатора Volume Weighted Average Price (VWAP)
1. Основные понятия
VWAP (объемно-взвешенная средняя цена) — это технический инструмент анализа, используемый для измерения средней цены сделки актива за определенный период с учетом объема торгов. Он помогает трейдерам определить текущую цену относительно «справедливой стоимости» рынка, часто применяется в дневной торговле, алгоритмической торговле и институциональном исполнении ордеров.
Основная формула:
VWAP=∑(Price×Volume)/∑Volume
Цена каждой свечи × объем торгов суммируется, затем делится на общий объем торгов, чтобы получить динамическую взвешенную среднюю цену.
2. Основные применения VWAP
Применение:
1)Определение справедливой рыночной цены
Цена выше VWAP = преимущество покупателей; ниже VWAP = преимущество продавцов.
2)Ссылки на поддержку/сопротивление
VWAP часто служит динамическим уровнем поддержки/сопротивления для краткосрочной торговли.
3)Подтверждение внутридневного тренда
Цена стабильно выше VWAP = доминирование быков; ниже = доминирование медведей.
Сводка
VWAP serves several key functions: it acts as a reference for fair value, where prices above VWAP indicate bullish bias and below indicate bearish bias; it provides dynamic support and resistance levels useful for intraday breakouts and reversals; and it helps confirm intraday trends, with prices sustained above VWAP signaling an uptrend and below signaling a downtrend.
This indicator supports various markets including forex, stocks, indices, commodities, and cryptocurrencies, making it a versatile tool for intraday market analysis and trading strategy development.


