
Описание
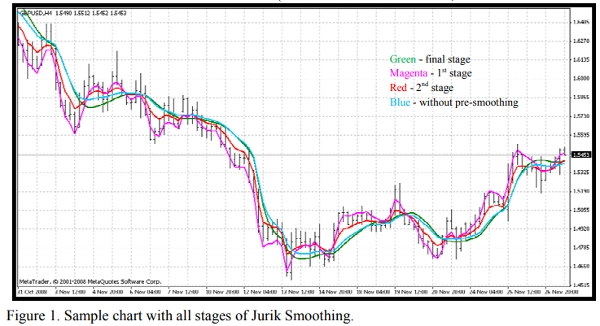
Сглаживание Jurik включает 3 этапа:
1-й этап - предварительное сглаживание адаптивным EMA: MA1 = (1-alpha)*Price + alpha*MA1[1];
2-й этап - ещё одно предварительное сглаживание фильтром Калмана: Det0 = (Price - MA1)*(1-beta) + beta*Det0[1]; MA2 = MA1 + PR*Det0;
3-й этап - окончательное сглаживание уникальным адаптивным фильтром Jurik: Det1 = (MA2 - JMA[1]) * (1-alpha)^2 + alpha^2 * Det1[1]; JMA = JMA[1] + Det1;
где: - Price - серия цен - alpha - динамический фактор (будет описан ниже) - beta - периодическое отношение = 0.45*(Length-1)/(0.45*(Length-1)+2) - PR - фазовое отношение: PR = Phase/100 + 1.5 (если Phase < -100, то PR=0.5, если Phase > 100, то PR=2.5).
Рисунок 1. Пример графика со всеми этапами сглаживания Jurik. Вы можете увидеть результаты (Рисунок 1) каждого этапа с помощью прилагаемого индикатора JurikFilter_v2, изменяя FilterMode: 0 - конечный этап (JMA) 1 - 1-й этап 2 - 2-й этап 3 - только финальное (без предварительного) сглаживание.
Динамический фактор — это периодический фактор (beta), возведённый в степень (pow):
alpha = beta ^ Pow,
где: - pow = rVolty ^ pow1 - rVolty - относительная волатильность цены - pow1 - степень относительной волатильности по формуле: pow1 = len1 - 2 (если pow1 < 0.5, то pow1 = 0.5),
где len1 - дополнительный периодический фактор: len1 = Log(SquareRoot(len))/Log(2.0) + 2 (если len1 < 0, то len1 = 0).
Таким образом, вы можете видеть, что динамический фактор основан на относительной волатильности цены, обеспечивая необходимую адаптивность для такого типа ценового фильтра.
Формула для относительной волатильности цены: rVolty = Volty/AvgVolty (если rVolty > len1^(1/pow1), то rVolty = len1^(1/pow1), если rVolty < 1, то rVolty = 1),
где:
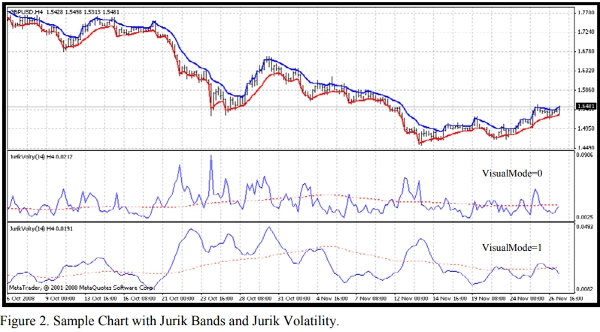
- Volty - волатильность цены, основанная на расчёте так называемых полос Jurik (VisualMode = 1).
- AvgVolty - средняя волатильность, для которой Jurik использует достаточно сложный алгоритм расчёта: AvgVolty = Average(vSum,AvgLen),
где:
- vSum - накопительная сумма (Volty - Volty[10])/10;
- AvgLen - период усреднения (Jurik использует 65).
В моей версии фильтра Jurik я использую простое среднее вместо сложного усреднения Jurik.
Кроме того, с прилагаемым индикатором JurikVolty_v1 (Рисунок 2) вы можете видеть значения Volty (VisualMode=0), vSum (VisualMode=1) и AvgVolty (красная пунктирная линия).
Формула для волатильности цены: Volty = максимум из Abs(del1) и Abs(del2), если Abs(del1) = Abs(del2), то Volty = 0,
где: - del1 - расстояние между ценой и верхней полосой del1 = Price - UpperBand - del2 - расстояние между ценой и нижней полосой del2 = Price - LowerBand Полосы Jurik отличаются от любых известных ценовых полос, таких как Bollinger, Keltner, Donchian, Fractal и так далее: если del1 > 0, то UpperBand = Price, иначе UpperBand = Price - Kv*del1 если del2 < 0, то LowerBand = Price, иначе LowerBand = Price - Kv*del2,
где: - Kv - коэффициент волатильности Kv = bet ^ SquareRoot(pow2). Легко видеть, что эти полосы могут служить основой для индикатора следования за трендом, подобного параболическому индикатору Уайлдера. Таким образом, можно сказать, что в алгоритме скользящей средней Jurik (JMA) практически нет неясных мест.
Сводка
Отзывы покупателей
5 | 0 % | |
4 | 100 % | |
3 | 0 % | |
2 | 0 % | |
1 | 0 % |


![Логотип продукта "[Hamster-Coder] Pivot Points MTF"](https://cdn.ctrader.com/image/webp/4c143e5a-309c-40e3-a578-f04d1e133ffa_31159)


