
Descripción
Perfil de Volumen de Sesión HD
Qué Hace
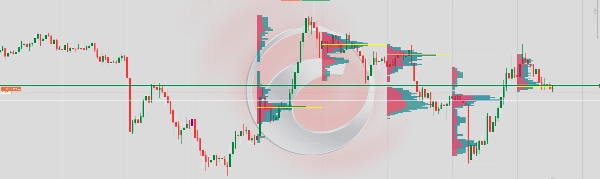
Muestra un perfil de volumen horizontal para cada sesión de trading directamente en el gráfico. Muestra cómo se distribuye el volumen de trading a través de los niveles de precio, ayudando a los traders a identificar zonas de alta actividad, áreas de valor justo y niveles clave de soporte/resistencia derivados puramente del comportamiento del volumen.
Cómo Funciona
En cada cierre de barra nuevo, el indicador escanea todas las barras dentro del número definido de sesiones y distribuye el volumen de ticks de cada barra a lo largo de su rango de precios. El volumen se divide en lado de compra (barras alcistas) y lado de venta (barras bajistas) usando la dirección de apertura/cierre de la barra como proxy. El resultado se representa como un histograma horizontal en capas anclado al límite temporal de la sesión.
Elementos Visuales
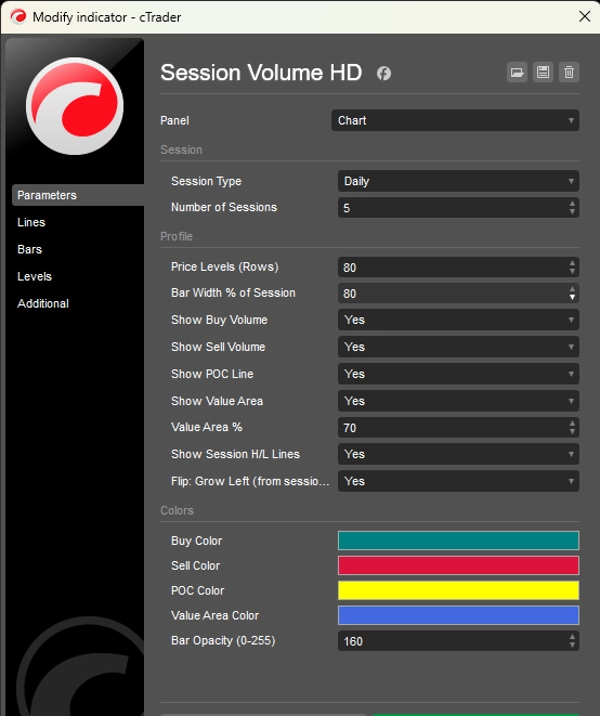
Barras de Compra (Verde azulado) — Muestran el volumen negociado en movimientos de precio alcistas en cada nivel. Crecen hacia la izquierda (o hacia la derecha si están invertidas) desde el ancla de la sesión.
Barras de Venta (Rojo) — Muestran el volumen negociado en movimientos de precio bajistas en cada nivel, apiladas junto a las barras de compra.
Línea POC (Amarilla) — Punto de Control. Una línea horizontal que marca el nivel de precio con el mayor volumen total en la sesión. Actúa como un imán para el precio.
Área de Valor (Superposición Azul) — El rango de precios que contiene un porcentaje configurable (por defecto 70%) del volumen total de la sesión. Representa la zona de "valor justo" donde ocurrió la mayor parte del trading.
Líneas H/L de Sesión (Punteadas Blancas) — Marcan el precio más alto y más bajo alcanzado durante la sesión.
Rendimiento
El indicador se redibuja solo una vez por cada nueva barra, no en cada tick. Esto elimina el parpadeo y asegura una representación estable incluso con muchas sesiones y un alto número de niveles de precio.
Limitaciones
Dado que cTrader no expone el volumen real de oferta/demanda a nivel de barra sin una fuente de datos de ticks, el volumen de compra/venta se aproxima usando la dirección de la barra: las barras alcistas se ponderan 65% compra / 35% venta, las barras bajistas al revés, y las barras doji se dividen 50/50. Para un volumen delta real se requeriría una suscripción a datos de ticks.


