
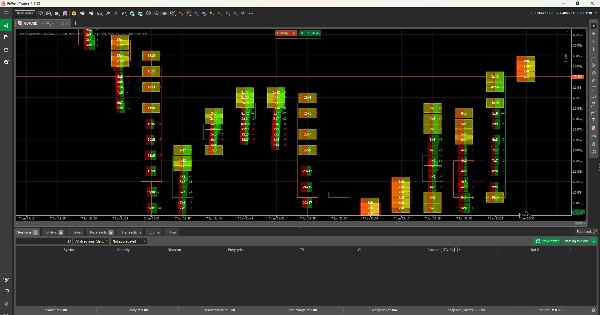
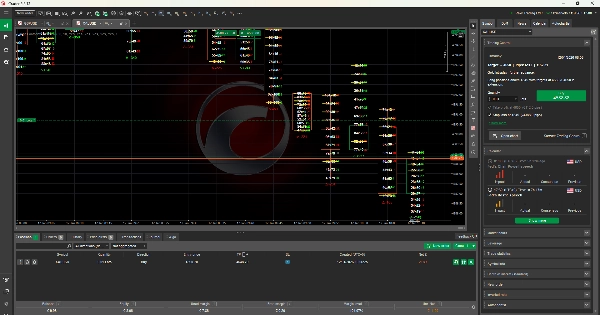
Delta Footprint Bid x Ask
Indicador
2 compras
Versión 2.0, Feb 2026
Windows, Mac
4.5
Valoraciones: 2
Descripción
Qué incluye:
- Resumen - Qué hace el indicador
- Concepto de Huella - Qué es el trading de huella
- Método Detallado de Cálculo - Cómo se calculan los volúmenes:
-
- Creación de nivel de precio
- Algoritmo de distribución de volumen
- Lógica de división compra/venta
- Ejemplos de cálculos
- Explicación de la Visualización de Volumen - Qué significa "45x120"
- Interpretación del Delta - Positivo, negativo y acumulativo
- Características Clave - Desequilibrios, POC, barras de volumen
- Teoría del Flujo de Órdenes - Explicación de oferta vs demanda
- Limitaciones Importantes - Explicación honesta de que es estimado, no datos reales de ticks
- Aplicaciones de Trading - 5 escenarios reales de trading
- Guía de Configuración - Explicación completa de todos los parámetros
- Recomendaciones de Marco Temporal - Mejores configuraciones para diferentes estilos
- Consejos y Mejores Prácticas
Puntos Clave Sobre el Cálculo:
El documento explica claramente que:
Los volúmenes son ESTIMADOS - porque cTrader no proporciona datos reales de ticks El algoritmo es inteligente - usa múltiples factores (tipo de vela, posición del precio, proximidad del cierre) Los patrones son precisos - las relaciones relativas reflejan el flujo real de órdenes Honesto sobre las limitaciones - explica cuándo se necesitan datos reales del intercambio Muestra fórmulas exactas - transparencia completa en los cálculos
¡Esto da a los usuarios expectativas realistas mientras destaca el valor del indicador! 📊
Resumen
Resumen de IA
Delta Footprint Bid x Ask is a footprint volume indicator designed to display bid and ask volume splits at each price level. It estimates volume distribution using an intelligent algorithm that incorporates factors such as candle type, price position, and close proximity, as real tick data is not available on the cTrader platform. The indicator provides detailed volume calculations, including price level creation, buy/sell split logic, and example computations, offering transparency through exact formulas. Key features include identification of volume imbalances, point of control (POC), and volume bars, supporting analysis of order flow by comparing bid versus ask volumes. The indicator explains delta values—positive, negative, and cumulative—and offers guidance on settings and timeframe recommendations for various trading styles. It is applicable across multiple markets and symbols, including Forex pairs (EURUSD, GBPUSD, USDJPY, NZDUSD), indices (NAS100, SP500, DAX), commodities (gold, oil, silver), cryptocurrencies (BTCUSD), and stocks. The tool includes practical trading applications and best practices, helping users interpret footprint patterns that realistically mirror order flow despite volume estimates.
Perfil del indicador
Valoraciones de clientes
4.5
Valoraciones: 2
5 | 50 % | |
4 | 50 % | |
3 | 0 % | |
2 | 0 % | |
1 | 0 % |
Valoraciones de clientes
January 20, 2026
For volume based context, this feels more useful as a filter than a full system. The journal should cover 55 setups and the trade context.
January 12, 2026
For me the fair test is value area with POC and VWAP. If the result still looks clean, the product becomes easier to trust.
Conversación
Preguntas frecuentes
BTCUSD
Forex
Signal
Indices
EURUSD
Commodities
GBPUSD
NZDUSD
Prop
Scalping
Supertrend
Fair Value Gap
Crypto
Stocks
XAUUSD
NAS100
USDJPY
Los productos disponibles a través de cTrader Store, incluidos bots, indicadores y plugins para operar, son proporcionados por desarrolladores de terceros y están disponibles únicamente con fines informativos y de acceso técnico. cTrader Store no es un bróker, por lo que no proporciona asesoramiento de inversión, recomendaciones personales ni ninguna garantía de rentabilidad futura.
Más de este autor


Precio
Desde 15/01/2025
7
Ventas