
present
Inscrivez-vous et bénéficiez d'une remise de 50 $ sur votre premier achat
Trading product for Fibonacci Automated Level Indicateur Signal Indices, image 1
Fibonacci Automated Level
Indicateur
1 achats
Version 1.0, Apr 2026
Windows, Mac
4.0
Avis : 3
Trading product for Fibonacci Automated Level Indicateur Signal Indices, image 2
Trading product for Fibonacci Automated Level Indicateur Signal Indices, image 3
Trading product for Fibonacci Automated Level Indicateur Signal Indices, image 4
Trading product for Fibonacci Automated Level Indicateur Signal Indices, image 5
Trading product for Fibonacci Automated Level Indicateur Signal Indices, image 6
Depuis le 29/05/2025
3.04M
Volume tradé
45.22K
Pips gagnés
29
Ventes
810
Installations gratuites

Description

📊 Indicateur Automatisé des Niveaux de Fibonacci (BOSSFXTRADER v1.0)

🔍 Description

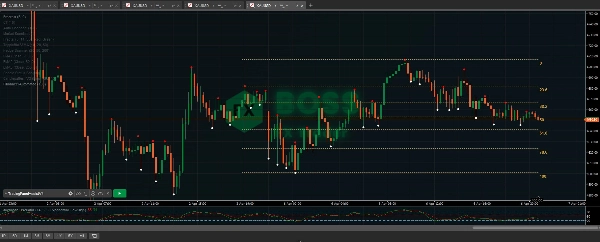
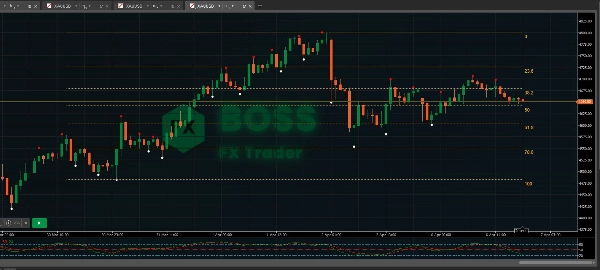
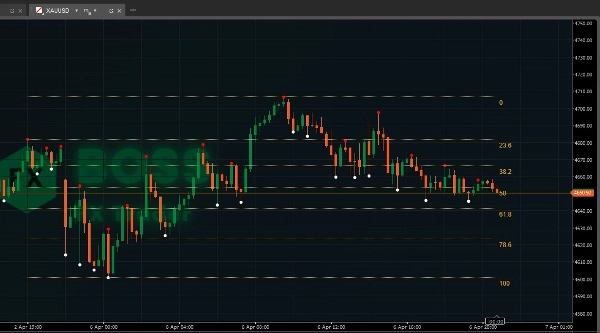
L’Indicateur Automatisé des Niveaux de Fibonacci est un outil de trading intelligent qui détecte automatiquement le dernier mouvement du marché (plus haut & plus bas) sur une période définie et trace directement sur votre graphique les niveaux clés de retracement de Fibonacci.

Contrairement au tracé manuel de Fibonacci, cet indicateur :

  • Élimine la subjectivité
  • Se met à jour dynamiquement avec la structure du marché
  • Aide les traders à identifier des zones d’entrée, de sortie et de retournement à haute probabilité

Il fonctionne sur tout marché (Forex, Or, Crypto, Indices) et sur toutes les unités de temps.


⚙️ Comment ça fonctionne

  • Analyse les X dernières bougies (Barres de retour)
  • Détecte :
    • Plus haut le plus élevé
    • Plus bas le plus bas
  • Détermine la direction de la tendance :
    • 📈 Tendance haussière → Fib tracé du Bas vers le Haut
    • 📉 Tendance baissière → Fib tracé du Haut vers le Bas
  • Trace automatiquement ces niveaux :
    • 0.0
    • 23.6%
    • 38.2%
    • 50.0%
    • 61.8%
    • 78.6%
    • 100%


🎯 Comment l’utiliser efficacement en trading

1. 🔥 Entrées basées sur la tendance (MEILLEURE STRATÉGIE)

📈 En tendance haussière :

  • Attendez que le prix recul
  • Concentrez-vous sur ces zones :
  • Entrez en ACHAT lorsque :
    • Une bougie haussière apparaît
    • Signal d’achat fort (de votre autre indicateur)

📉 En tendance baissière :

  • Attendez que le prix retrace vers le haut
  • Concentrez-vous sur :
  • Entrez en VENTE lorsque :
    • Une bougie baissière apparaît
    • Signal de vente fort


2. 🎯 Entrée Sniper (Configuration Avancée 🔥)

Combinez vos niveaux Fib avec votre système existant :

Exemple d’ACHAT :

  • Tendance = Haussière
  • Le prix recule vers 0.5 ou 0.618
  • Votre indicateur affiche :
    • ✅ Achat fort
    • ✅ Bougie à corps important
    • ✅ Petite mèche supérieure

👉 ENTREZ EN ACHAT (Entrée Sniper)

Exemple de VENTE :

  • Tendance = Baissière
  • Le prix retrace vers 0.5 ou 0.618
  • Le signal confirme :
    • ❌ Vente forte

👉 ENTREZ EN VENTE


3. 💰 Objectifs de prise de profit

Utilisez les niveaux Fib comme zones de TP :

  • TP1 → 0.236
  • TP2 → Plus haut/bas précédent (0.0 ou 1.0)
  • TP3 → Cassure au-delà de 1.0 (poursuite de la tendance)


4. 🛑 Placement du Stop Loss

Placement intelligent du SL :

  • En dessous de 0.786 (pour ACHAT)
  • Au-dessus de 0.786 (pour VENTE)

Cela évite d’être stoppé par le bruit normal du marché.


5. ⚠️ Évitez ces erreurs

❌ Trader dans un marché latéral
❌ Entrer sans confirmation
❌ Utiliser Fib seul (toujours combiner avec des signaux)
❌ Ignorer la tendance sur des unités de temps supérieures


🧠 Astuces Pro (Style BOSS FX)

  • Combinez avec :
    • Filtre de tendance EMA / HMA
    • Signaux Achat Fort / Vente Forte (votre système 🔥)
  • Meilleures unités de temps :
    • M5 (scalping)
    • M15 (entrées sniper)
    • H1 (confirmation)
  • Meilleurs actifs :
    • XAUUSD (Or)
    • EURUSD
    • GBPJPY


🚀 Meilleure combinaison de stratégie (RECOMMANDÉ)

Utilisez cette configuration :

  • Niveaux Automatisés de Fibonacci ✅
  • Votre indicateur Achat/Vente Fort ✅
  • Confirmation de tendance multi-unités de temps ✅

👉 Cela crée un système de trading sniper à haute précision


📌 Résumé

Cet indicateur vous aide à :

  • Identifier automatiquement la structure du marché
  • Trader les replis comme un pro
  • Entrer dans des zones à haute probabilité
  • Éliminer les approximations dans l’utilisation de Fibonacci


Concentrez-vous sur la victoire !

Résumé

Résumé IA
The Fibonacci Automated Levels Indicator is a trading tool that automatically identifies the most recent market swing high and low within a specified lookback period and plots key Fibonacci retracement levels on the chart. It dynamically updates with market structure, removing subjectivity from manual Fibonacci drawing. The indicator detects trend direction—drawing Fibonacci levels from low to high in uptrends and high to low in downtrends—and plots standard retracement levels: 0.0, 23.6%, 38.2%, 50.0%, 61.8%, 78.6%, and 100%.

It supports all markets including Forex, Gold, Cryptocurrencies, and Indices, and works across all timeframes. Traders can use it to identify high-probability entry, exit, and reversal zones by focusing on pullbacks to key Fibonacci levels (notably 0.382 to 0.618). The indicator is designed to be combined with other signals and trend filters for confirmation, enhancing trade accuracy. It also provides guidance on take profit targets and stop loss placement to manage risk effectively.

Recommended usage includes trend-based entries, sniper entries combining Fibonacci levels with other indicators, and multi-timeframe trend confirmation. The indicator is suitable for scalping and various trading styles, helping traders automate market structure analysis and improve pullback trading decisions.
Profil de l'indicateur

Avis clients

4.0
Avis : 3
5
0 %
4
100 %
3
0 %
2
0 %
1
0 %
Avis clients
April 13, 2026
A decent setup here should survive 0.5 Fib without looking messy. Risk and average R matter more than one clean screenshot.
April 11, 2026
I liked it more as a review layer for Fib based analysis than as something to follow blindly. Pullbacks feel easier to plan, and the final decision still feels like it belongs to the trader.
April 11, 2026
For Fib based analysis, the practical question is whether it reduces bad decisions. A 90 setup journal on New York open makes that clearer.

Discussion

Questions fréquentes

Signal
Indices
Commodities
GBPUSD
RSI
Bollinger
Fibonacci
Scalping
AI
XAUUSD
NAS100
MACD
BTCUSD
Forex
Breakout
EURUSD
NZDUSD
Martingale
Prop
ZigZag
Supertrend
Fair Value Gap
SMC
Crypto
Grid
Stocks
ATR
USDJPY
VWAP
Les produits disponibles sur cTrader Store, notamment les bots de trading, les indicateurs et les plug-ins, sont fournis par des développeurs tiers et mis à disposition à titre informatif et à des fins d'accès technique uniquement. cTrader Store n'est pas un courtier et ne fournit aucun conseil en investissement, aucune recommandation personnelle ni aucune garantie quant aux performances futures.

Plus de cet auteur

Indicateur
Market Sessions is very important for traders.
Indicateur
Signal
Fractal Arrow Buy and Sell Indicator
Indicateur
The Break of Structure (BoSCHoCh) Indicator is a smart market structure tool designed to help traders easily spot trend.
Indicateur
MultiTF Pivot and SR Indicator
Logo de "Zigzag Trend"
Les mieux notés
4.5
(4)
$25
/
$45
Indicateur
AI
ATR
+23
The ZigZag Trend is a market structure tool that filters out small price fluctuations and highlights major swing.
cBot
AI
SMC
+18
Quick Trading Panel Cbot allows you to trade faster using a panel in a chart. This includes Trailing Trigger and Locked.
3
Facteur de profit
Indicateur
Area of Interest with the power of AI to detect the market interest.
Indicateur
Prop
Forex
+13
Volume Meter
Indicateur
AI
ATR
+23
Candle Timer best used for Scalper
Indicateur
AI
ATR
+27
Intraday MultiTimeframe Candle Status Indicator
Indicateur
The Market BIAS Detector is a smart trading assistant designed to identify the market.
Indicateur
Forex
Spread Calculator to calculate the difference between two prices or values.

Vous pourriez aussi aimer

Indicateur
Volume
Moving Average
Multi-Timeframe Rolling Volatility Indicator - Smart Volatility Breakout System
Indicateur
Key Levels
Support & Resistance
Professional Opening Range Breakout indicator with live ORB levels and breakout detection.
Indicateur
Forex
BTCUSD
+5
Daily/Weekly/Monthly - Highs & Lows Indicator (Customizable Settings)
Indicateur
CHOCH
Fair Value Gap
+2
Advanced FVG & IFVG indicator with multi-timeframe confluence, CHoCH filtering, and smart mitigation.
Indicateur
Volume
Key Levels
Dynamic Visible Range Volume Profile for cTrader. Real-time POC, Value Area & Smart Alerts for precise trading.
Indicateur
AI
ATR
+9
Scalp smarter with DOM Flow Scalper PRO – real-time Bid/Ask imbalance and volume precision!
Indicateur
ATR
RSI
+6
🔍 MultiScalpScorePRO – Powerful real-time scoring system combining indicators for ultra-precise scalping signals.
Indicateur
Prop
Forex
+13
🐠 Coral Filter X Pro turns trend detection into a simple, repeatable workflow 🐠
Indicateur
Forex
Renko scalping indicator
Indicateur
SMC
Forex
+5
Detect institutional breakout zones with smart volume & channel analysis — by PrimeQuant.
Indicateur
Grid
Prop
+5
This technical analysis indicator provides information on market sentiment, trend and price levels....
Indicateur
Forex
BTCUSD
+12
Pro Structure Patterns Detector
Indicateur
VWAP
Volume
+4
Advanced Order Flow & Volume Profiling for cTrader. Unveil institutional footprints, Delta, and Anchored VWAPs.
Indicateur
ATR
Channel
+3
Catch trend with precision. BUY/SELL arrows, real-time dashboard, sound alerts and ATRchannel. Works on all markets.
Indicateur
SMC
Breakout
+1
Delta Peak Bubbles is a tick‑chart overlay for cTrader that highlights the strongest momentum spikes.
Indicateur
Signal
New Trend whit buy-sell signal
Indicateur
ATR
Signal
One of the best indicators we have ever developed, with a very high profit ratio.
Indicateur
VWAP
Volume
+4
Volume Profile + VWAP with Standard Deviations

Prix

Depuis le 29/05/2025
3.04M
Volume tradé
45.22K
Pips gagnés
29
Ventes
810
Installations gratuites