
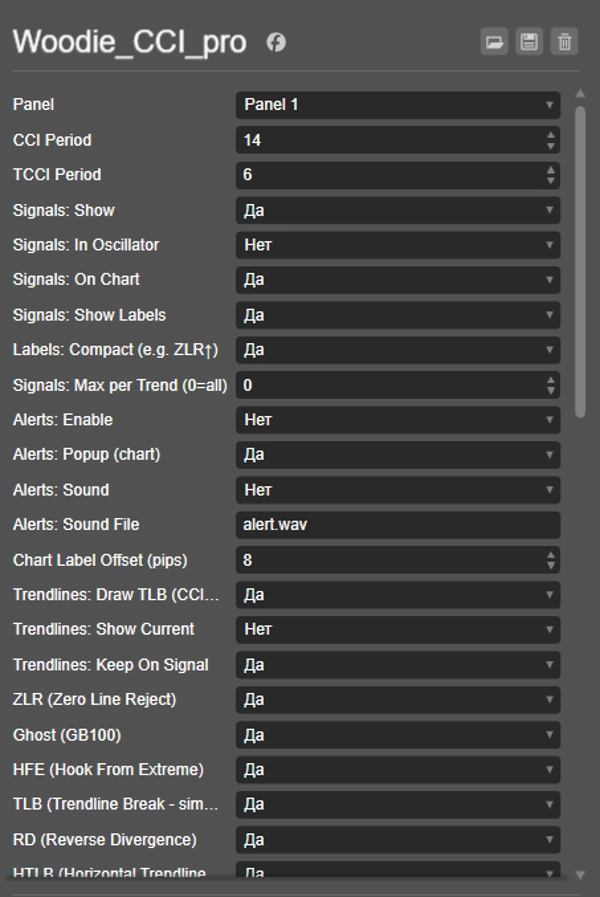
Mô tả
Woodie_CCI_pro là một bộ công cụ nâng cao dựa trên CCI được xây dựng xoay quanh phương pháp cổ điển Woodie CCI.
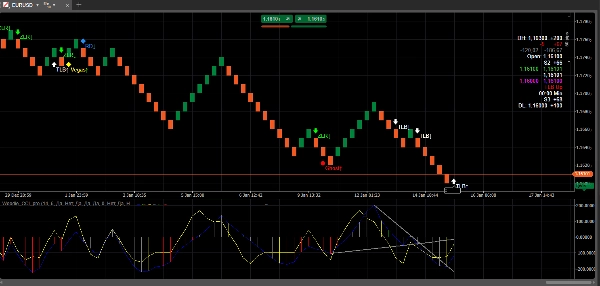
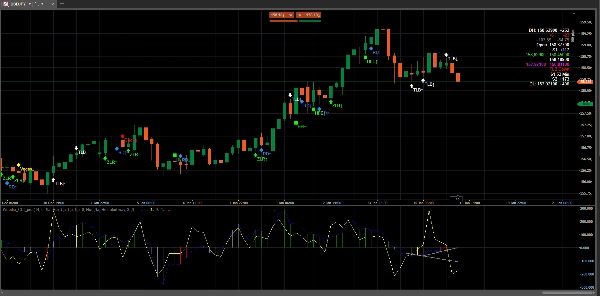
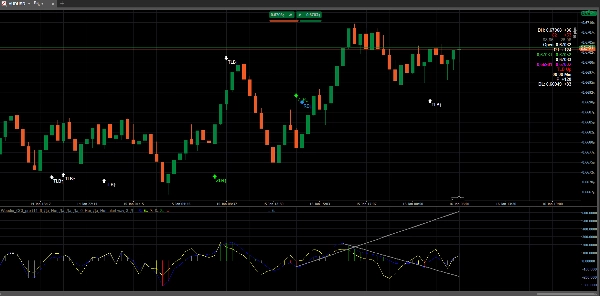
Nó vẽ một CCI kiểu Woodie với làm mượt và làm nổi bật các mẫu Woodie quan trọng nhất với tín hiệu rõ ràng trên biểu đồ, các dấu hiệu dao động tùy chọn và hướng dẫn đường xu hướng TLB bên trong khung CCI để có bối cảnh tốt hơn và ra quyết định nhanh hơn.
Được thiết kế cho tầm nhìn lịch sử rõ ràng: tất cả các tín hiệu được vẽ trên lịch sử, nhãn hiển thị tên mẫu chính xác, và việc hiển thị đường xu hướng được tối ưu để tránh méo mó tỷ lệ và “hiện tượng đường thừa”.
Các Tính Năng Chính
1) Phát Hiện Mẫu Woodie (Tín Hiệu Tự Động)
Woodie_CCI_pro phát hiện và gán nhãn các mẫu Woodie sau:
- ZLR (Từ Chối Đường Zero)
- Ghost
- HFE (Móc Từ Cực Đoan)
- TLB (Phá Vỡ Đường Xu Hướng)
- HTLB (Phá Vỡ Đường Xu Hướng Ngang)
- RD (Phân Kỳ Ngược)
- Famir
- Giao Dịch Vegas (VT)
Mỗi tín hiệu được vẽ với các dấu hiệu nhận biết hướng (Lên/Xuống) và một nhãn (ví dụ, ZLR↑, TLB↓) để bạn luôn biết chính xác tín hiệu nào đã kích hoạt.
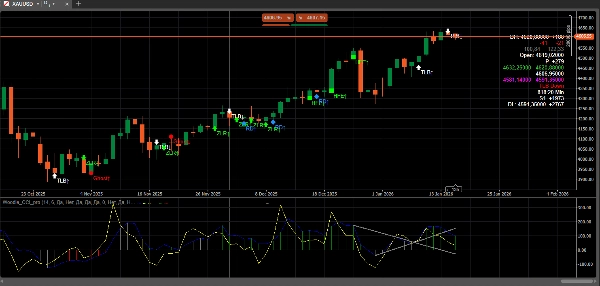
2) Tín Hiệu Trực Tiếp Trên Biểu Đồ Giá
Tín hiệu được hiển thị trên biểu đồ giá dưới dạng mũi tên/biểu tượng với nhãn văn bản để đảm bảo rõ ràng tối đa khi xem lại lịch sử và các thiết lập trực tiếp.
Các tùy chọn bao gồm:
- hiện/ẩn tín hiệu trên biểu đồ
- hiện/ẩn nhãn
- định dạng nhãn gọn (ví dụ:
RD↑) - điều chỉnh vị trí nhãn/dấu hiệu theo pip để đặt gọn gàng
3) Dấu Hiệu Dao Động Tùy Chọn
Nếu bạn thích cảm giác Woodie cổ điển, bạn có thể bật tùy chọn dấu hiệu tín hiệu bên trong khung CCI (điểm/chấm).
Điều này hoàn toàn tùy chọn để dao động vẫn sạch sẽ khi bạn chỉ muốn tín hiệu ở cấp độ biểu đồ.
4) Hướng Dẫn Đường Xu Hướng TLB Trong Khung CCI (Không Có Vấn Đề Tỷ Lệ)
Để nhận biết cấu trúc tốt hơn, chỉ báo có thể vẽ đường xu hướng TLB bên trong khung CCI:
- Đường TLB hiện tại (hướng dẫn từ dao động gần nhất)
- Tùy chọn Giữ Tín Hiệu để bảo lưu đường xu hướng được sử dụng tại thời điểm phá vỡ cho việc xem lại sau này
Việc hiển thị được thiết kế để giữ sạch sẽ trên lịch sử và tránh các “hiện tượng mép” hoặc thay đổi tỷ lệ cưỡng bức.
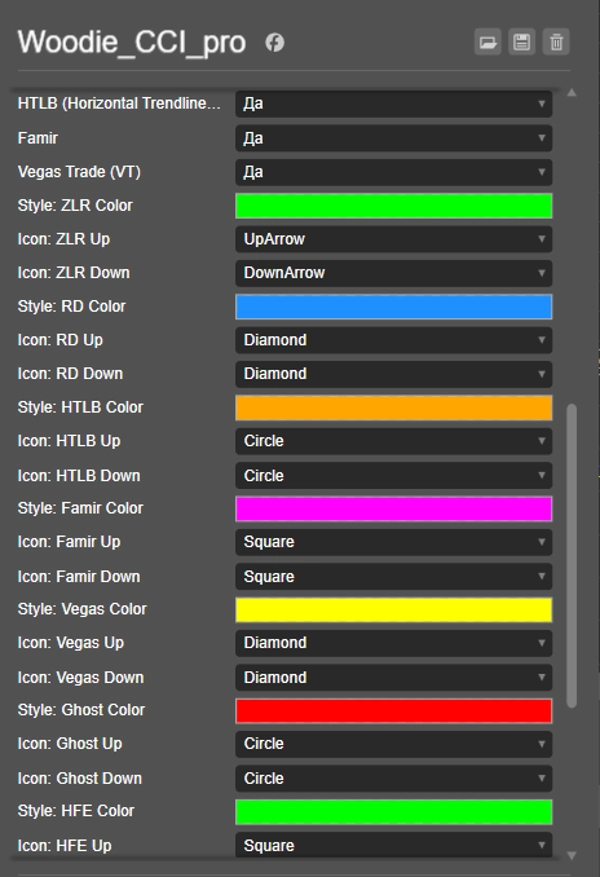
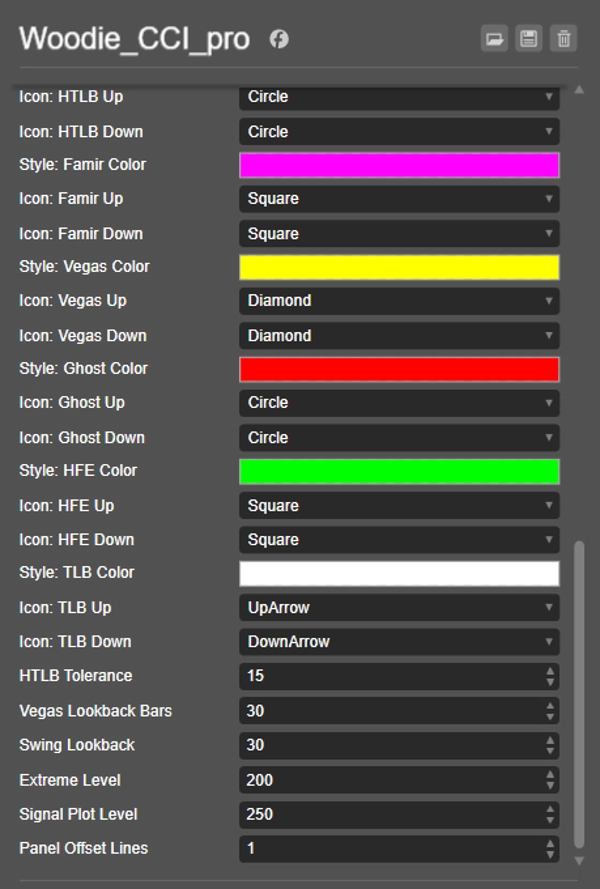
5) Kiểm Soát Phong Cách & Trực Quan (Theo Mẫu)
Bạn có thể tùy chỉnh giao diện trực quan theo từng mẫu:
- loại biểu tượng cho Lên/Xuống
- màu sắc theo mẫu (nếu được hỗ trợ)
- nhãn gọn so với đầy đủ
6) Cảnh Báo (Tùy Chọn)
Bật cảnh báo cho các tín hiệu được chọn:
- thông báo kiểu popup trên biểu đồ
- thông báo âm thanh tùy chọn (nếu nền tảng của bạn hỗ trợ)
7) Bộ Lọc “Tối Đa Tín Hiệu Theo Xu Hướng” (Tùy Chọn)
Để giảm nhiễu, bạn có thể giới hạn tín hiệu theo xu hướng:
Tối đa theo Xu Hướng (0 = không giới hạn)- chỉ đếm tín hiệu phù hợp với xu hướng hiện tại (dựa trên dấu hiệu TCCI)
Quy Trình Làm Việc Điển Hình
- Thêm Woodie_CCI_pro vào biểu đồ.
- Bật Tín Hiệu Trên Biểu Đồ và Nhãn để nhanh chóng nghiên cứu hành vi mẫu trên lịch sử.
- Bật đường xu hướng TLB nếu bạn muốn bối cảnh cấu trúc cho các giao dịch phá vỡ và tiếp tục.
- Tùy chọn bật Dấu Hiệu Dao Động nếu bạn thích xác nhận chấm Woodie cổ điển.
Ghi Chú & Triết Lý
- Chỉ báo này nhằm mục đích thực tế và dễ đọc hơn là “quá khớp”.
- Một số mẫu (đặc biệt là các mẫu dựa trên đường như TLB/HTLB/RD/Vegas) bao gồm các dung sai/độ nhìn lại có thể điều chỉnh vì cấu trúc thị trường khác nhau giữa các mã/chung thời gian.
- Kết quả trực quan được tối ưu cho lịch sử sạch, tỷ lệ ổn định và tối thiểu sự lộn xộn.
Tóm tắt
Đánh giá của khách hàng
5 | 50 % | |
4 | 50 % | |
3 | 0 % | |
2 | 0 % | |
1 | 0 % |


