
Mô tả
Chỉ báo Sơ đồ Wyckoff Wyckoff Schematic Indicator là một công cụ cấu trúc thị trường chuyên nghiệp được thiết kế để tự động phát hiện và trực quan hóa các giai đoạn tích lũy và phân phối Wyckoff trực tiếp trên biểu đồ.
Được xây dựng dựa trên các nguyên tắc của Phương pháp Wyckoff, chỉ báo này xác định các sự kiện tổ chức quan trọng như Đỉnh bán (SC), Phản ứng tự động (AR), Spring, Dấu hiệu sức mạnh (SOS), Đỉnh mua (BC), Upthrust (UTAD) và nhiều hơn nữa — giúp các nhà giao dịch hiểu được hành vi tiền thông minh trong thời gian thực.
Không giống như các chỉ báo truyền thống, công cụ này không dựa vào các tín hiệu trễ mà thay vào đó tập trung vào cấu trúc giá, hành vi khối lượng và biến động, cung cấp cái nhìn sâu sắc hơn về động lực thị trường.
Khái niệm cốt lõi
Chỉ báo dựa trên ý tưởng rằng thị trường di chuyển qua các chu kỳ có cấu trúc:
- Tích lũy → Tăng giá → Phân phối → Giảm giá
Nó tự động phát hiện và trực quan hóa:
- Các dải thị trường
- Các giai đoạn Wyckoff (A–E)
- Các sự kiện tổ chức quan trọng
- Các đột phá và giả đột phá cấu trúc
Tính năng chính
1. Phát hiện giai đoạn Wyckoff tự động
Chỉ báo xác định tất cả các giai đoạn chính của chu kỳ Wyckoff:
- Giai đoạn A – Dừng xu hướng
- Giai đoạn B – Xây dựng nguyên nhân (hình thành dải)
- Giai đoạn C – Spring / UTAD (giả phá vỡ)
- Giai đoạn D – Xác nhận xu hướng (SOS / SOW)
- Giai đoạn E – Tiếp tục xu hướng
Mỗi giai đoạn được làm nổi bật bằng màu sắc có thể tùy chỉnh để nhận biết ngay lập tức.
2. Nhận diện sự kiện thông minh
Hệ thống phát hiện các sự kiện Wyckoff quan trọng:
Tích lũy:
- SC – Đỉnh bán
- AR – Phản ứng tự động
- ST – Kiểm tra thứ cấp
- Spring – Phá vỡ giả
- SOS – Dấu hiệu sức mạnh
- LPS – Điểm hỗ trợ cuối cùng
Phân phối:
- BC – Đỉnh mua
- AR – Phản ứng tự động
- ST – Kiểm tra thứ cấp
- UTAD – Upthrust sau phân phối
- SOW – Dấu hiệu yếu
- LPSY – Điểm cung cuối cùng
Các sự kiện này được vẽ trực tiếp trên biểu đồ với nhãn.
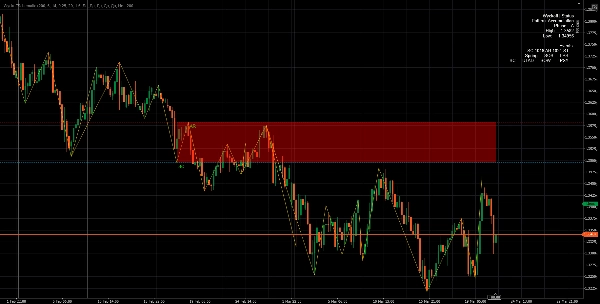
3. Phát hiện dải thích ứng
Chỉ báo xây dựng và cập nhật các dải giao dịch một cách động:
- Tự động phát hiện đỉnh và đáy dải
- Điều chỉnh ranh giới bằng độ dung sai dựa trên ATR
- Hiển thị vùng hỗ trợ và kháng cự
Điều này cho phép các nhà giao dịch dễ dàng nhìn thấy nơi thị trường đang tích lũy hoặc phân phối.
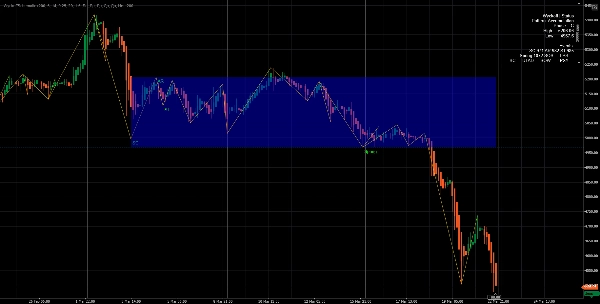
4. Bộ máy cấu trúc ZigZag
Một hệ thống ZigZag dựa trên điểm xoay tích hợp:
- Lọc nhiễu thị trường
- Làm nổi bật các đỉnh và đáy cấu trúc thực sự
- Đảm bảo nhận dạng mẫu chính xác
Điều này rất cần thiết để xác định các cấu trúc Wyckoff một cách đáng tin cậy.
5. Tích hợp khối lượng & biến động
Chỉ báo sử dụng:
- Trung bình động khối lượng
- Phát hiện đột biến khối lượng
- ATR (Khoảng dao động thực trung bình)
Điều này cho phép nó:
- Xác nhận hoạt động tổ chức
- Lọc các tín hiệu sai
- Cải thiện độ chính xác của các sự kiện như SC, BC, Spring, UTAD
6. Logic máy trạng thái thời gian thực
Về cốt lõi, chỉ báo chạy một thuật toán máy trạng thái mà:
- Theo dõi sự phát triển cấu trúc thị trường
- Chuyển đổi giữa các giai đoạn (A → E)
- Ngăn chặn tín hiệu trùng lặp
- Duy trì ngữ cảnh (Tích lũy so với Phân phối)
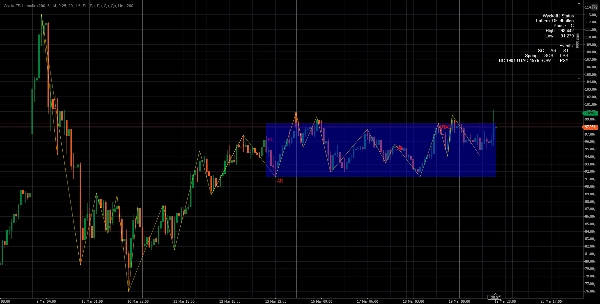
7. Thành phần trực quan
Chỉ báo cung cấp một bộ công cụ trực quan đầy đủ:
- ✔ Hộp làm nổi bật giai đoạn
- ✔ Đường đỉnh/đáy dải
- ✔ Đường cấu trúc ZigZag
- ✔ Nhãn sự kiện trên biểu đồ
- ✔ Bảng trạng thái thời gian thực
8. Bảng trạng thái (Thông tin thị trường trực tiếp)
Một bảng tích hợp hiển thị:
- Mẫu hiện tại (Tích lũy / Phân phối)
- Giai đoạn hiện tại (A–E)
- Ranh giới dải
- Các sự kiện đã phát hiện
Điều này cung cấp cho các nhà giao dịch cái nhìn tổng quan ngay lập tức về điều kiện thị trường.
9. Hệ thống cảnh báo
Tùy chọn cảnh báo bật lên thông báo khi các sự kiện chính xảy ra:
- SC, BC, Spring, UTAD, SOS, SOW, v.v.
Hoàn hảo để giám sát nhiều thị trường cùng lúc.
Ưu điểm
✔ Góc nhìn tiền thông minh
Không giống như các chỉ báo phổ biến, công cụ này tuân theo logic tổ chức, không phải chỉ báo bán lẻ.
✔ Phát hiện tín hiệu sớm
Xác định tích lũy/phân phối trước khi bứt phá, cho phép:
- Vào lệnh sớm
- Thiết lập tỷ lệ rủi ro/lợi nhuận tốt hơn
✔ Giảm nhiễu
Sử dụng điểm xoay, ATR và bộ lọc khối lượng, chỉ báo tránh:
- Tín hiệu ngẫu nhiên
- Nhiễu thị trường
- Phá vỡ giả
✔ Phân tích Wyckoff hoàn toàn tự động
Không cần đánh dấu thủ công:
- Các giai đoạn
- Các sự kiện
- Các dải
Mọi thứ đều được phát hiện tự động.
✔ Tùy chỉnh cao
Bạn có thể điều chỉnh:
- Khoảng thời gian nhìn lại
- Độ nhạy điểm xoay
- Độ dung sai ATR
- Độ nhạy khối lượng
- Các yếu tố trực quan (nhãn, hộp, đường)
✔ Tối ưu hiệu suất
- Sử dụng phân tích cửa sổ trượt
- Giới hạn đối tượng vẽ
- Hiệu quả cho giao dịch thời gian thực
Tham số đầu vào
Cấu trúc & Độ nhạy
- Thanh nhìn lại – phạm vi phân tích
- Chân điểm xoay – độ nhạy phát hiện dao động
Biến động & Độ dung sai
- Chu kỳ ATR
- Hệ số nhân ATR (Độ dung sai)
Phân tích khối lượng
- Chu kỳ MA khối lượng
- Hệ số nhân đột biến khối lượng
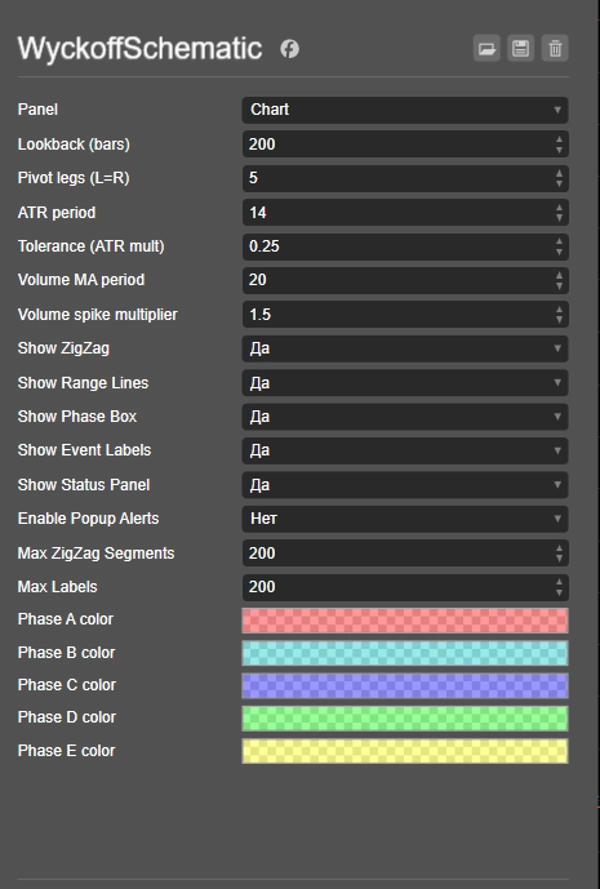
Trực quan hóa
- Hiển thị ZigZag
- Hiển thị đường dải
- Hiển thị hộp giai đoạn
- Hiển thị nhãn sự kiện
- Hiển thị bảng trạng thái
Cảnh báo
- Bật thông báo bật lên
Cách hoạt động (Đơn giản hóa)
- Phát hiện đỉnh/đáy điểm xoay (cấu trúc thị trường)
- Xác định ngữ cảnh xu hướng (tăng/giảm)
- Tìm kiếm đột biến khối lượng + điều kiện cấu trúc
- Khởi tạo mẫu Wyckoff (Tích lũy/Phân phối)
- Theo dõi sự kiện và giai đoạn từng bước
- Cập nhật hình ảnh biểu đồ theo thời gian thực
Trường hợp sử dụng tốt nhất
- Giao dịch tiền thông minh / Wyckoff
- Giao dịch bứt phá
- Giao dịch trong dải
- Phát hiện đảo chiều
- Phân tích luồng lệnh tổ chức
Kết luận
Chỉ báo Wyckoff Schematic Indicator là một công cụ phân tích mạnh mẽ biến lý thuyết Wyckoff phức tạp thành một hệ thống giao dịch tự động hoàn toàn, trực quan và có thể hành động.
Nó cho phép các nhà giao dịch:
- Hiểu được ý định thị trường
- Xác định các thiết lập có xác suất cao
- Giao dịch phù hợp với hành vi tổ chức
Tóm tắt
Đánh giá của khách hàng
5 | 100 % | |
4 | 0 % | |
3 | 0 % | |
2 | 0 % | |
1 | 0 % |


![Logo "[Hamster-Coder] Bollinger Bands"](https://cdn.ctrader.com/image/webp/21d8e5d6-fb11-4bac-b9ee-cd05c2b76804_30327)


