
Mô tả
SmartFibonacci — Tự động, có thể cấu hình các mức thoái lui & mở rộng Fibonacci với hỗ trợ khung thời gian cao hơn, nhãn giá và cảnh báo gần để đưa ra quyết định giao dịch nhanh hơn, tự tin hơn.
Mô tả ngắn sẵn sàng cho cửa hàng (1–2 dòng)
SmartFibonacci tự động phát hiện các điểm swing cao/thấp và vẽ các mức thoái lui Fibonacci rõ ràng cùng các mức mở rộng tùy chọn trên biểu đồ của bạn. Có thể cấu hình khoảng nhìn lại, phát hiện swing khung thời gian cao hơn, nhãn giá/phần trăm và cảnh báo gần làm cho nó lý tưởng cho cả giao dịch trong ngày và thiết lập swing.
Mô tả sản phẩm đầy đủ (sẵn sàng sao chép-dán cho cTrader Store)
SmartFibonacci là một chỉ báo cTrader nhẹ, tập trung vào hiệu suất, tự động hóa phân tích Fibonacci để bạn có thể dành ít thời gian hơn cho việc vẽ các mức và nhiều thời gian hơn cho giao dịch. Nó xác định swing cao và swing thấp gần nhất trong khoảng nhìn lại có thể cấu hình, vẽ các mức thoái lui và các mức mở rộng (dự đoán) tùy chọn, đồng thời hiển thị nhãn giá và phần trăm để giải thích nhanh. Để có tín hiệu mạnh mẽ, SmartFibonacci có thể tính toán các điểm swing trên khung thời gian cao hơn trong khi hiển thị các mức trên biểu đồ hiện tại của bạn. Cảnh báo tích hợp (popup + âm thanh) thông báo cho bạn khi giá đến gần trong khoảng pip có thể cấu hình của bất kỳ mức Fibonacci hiển thị nào.
Danh sách này bao gồm: ảnh chụp màn hình rõ ràng hiển thị các yếu tố giao diện người dùng chính, các quy trình làm việc ví dụ, cài đặt cấu hình và các đầu ra mẫu (nhãn giá, mở rộng, cảnh báo) để giúp người mua dễ dàng đánh giá chức năng và trải nghiệm người dùng trước khi mua.
Các tính năng chính
- Phát hiện swing tự động — tìm swing cao/thấp gần nhất trong cửa sổ nhìn lại có thể cấu hình.
- Tùy chọn swing khung thời gian cao hơn — tính toán các điểm swing trên khung thời gian cao hơn để có các mức mượt mà và ý nghĩa hơn.
- Thoái lui & Mở rộng — vẽ các đường thoái lui tiêu chuẩn và các mức mở rộng/dự đoán tùy chọn (phần trăm do người dùng định nghĩa như 127.2, 161.8, v.v.).
- Nhãn giá & phần trăm — mỗi mức hiển thị phần trăm và giá chính xác để quyết định nhanh chóng.
- Hình ảnh có thể tùy chỉnh — đặt màu sắc (thoái lui / mở rộng), độ dày đường và kiểu đường.
- Cảnh báo gần — popup + âm thanh khi giá vào bán kính pip có thể cấu hình của mức Fibonacci hiển thị; tùy chọn chỉ cảnh báo mức gần nhất.
- Logic vẽ lại hiệu quả — chỉ vẽ lại khi các điểm swing thay đổi để giảm lộn xộn biểu đồ và sử dụng CPU.
- Mặc định an toàn — các mặc định hợp lý cho nhà giao dịch muốn sử dụng ngay sau khi cài đặt.
- Tương thích với cTrader / cAlgo — thiết kế để chạy như một chỉ báo phủ lên.
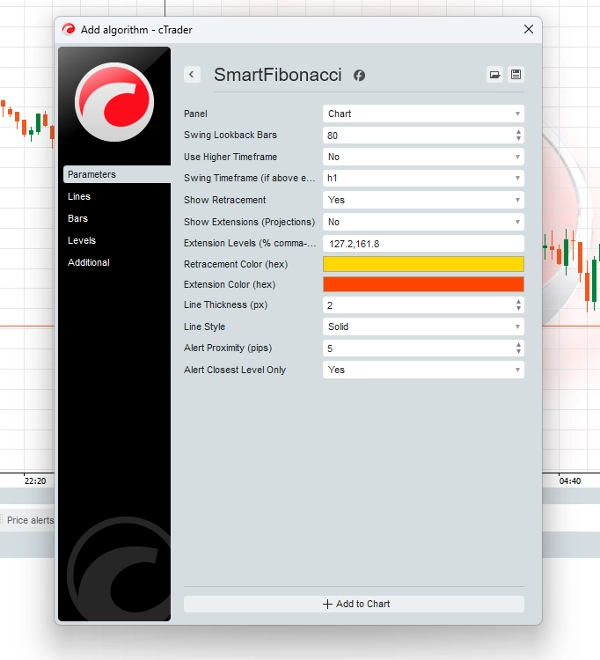
Cấu hình (tham số & giải thích)
- Số thanh nhìn lại Swing (int) — số thanh để tìm swing cao/thấp (mặc định 80).
- Sử dụng Khung Thời Gian Cao Hơn (bool) — bật phát hiện trên khung thời gian cao hơn trong khi vẽ trên biểu đồ hiện tại.
- Khung Thời Gian Swing (TimeFrame) — khung thời gian cao hơn được sử dụng khi
Use Higher Timeframeđược bật. - Hiển thị Thoái lui (bool) — bật/tắt vẽ các mức thoái lui.
- Hiển thị Mở rộng (bool) — bật/tắt vẽ các mức mở rộng/dự đoán.
- Các Mức Mở rộng (string) — các giá trị phần trăm cách nhau bằng dấu phẩy (ví dụ,
127.2,161.8) dùng để tạo các đường dự đoán. - Màu Thoái lui / Màu Mở rộng (hex) — chọn màu cho các đường thoái lui và mở rộng.
- Độ dày đường (px) — cài đặt độ dày đường là số nguyên.
- Kiểu đường (enum) — chọn đường liền, nét đứt, v.v.
- Cảnh báo Gần (pips) — khoảng cách tính bằng pip cho cảnh báo gần.
- Chỉ cảnh báo mức gần nhất (bool) — khi bật, chỉ mức fib gần nhất mới kích hoạt popup.
Đầu ra phân tích & các yếu tố trải nghiệm người dùng
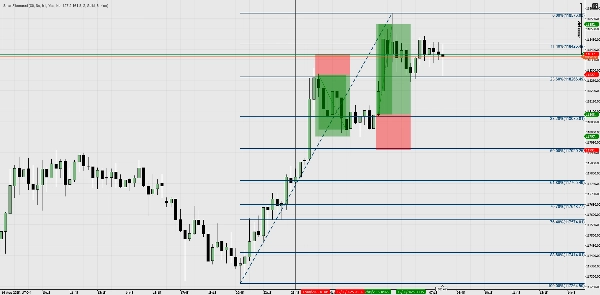
- Đường trên biểu đồ — các đường thoái lui và mở rộng với nhãn phần trăm rõ ràng (ví dụ, 61.8%) và nhãn giá (ví dụ, 1.23456).
- Thông báo popup — người dùng nhận được popup trên màn hình và âm thanh hệ thống khi giá vào khu vực
Alert Proximity. - Vẽ lại không gây phiền nhiễu — chỉ cập nhật khi swing phát hiện thay đổi để tránh nhấp nháy vẽ lại thường xuyên.
- Tính nhất quán nguồn giá — cảnh báo và nhãn được tính toán sử dụng cùng chuỗi Bars mà fib được vẽ trên đó (quan trọng khi sử dụng tính toán khung thời gian cao hơn).
Quy trình làm việc ví dụ / kịch bản sử dụng
- Thiết lập nhanh (scalping / trong ngày)
-
- Gắn SmartFibonacci vào biểu đồ 5 phút, đặt
Lookback = 80,ShowRetrace = true. - Theo dõi các mức thoái lui và sử dụng 61.8% / 50% làm vùng phản ứng trong ngày.
- Bật
Alert Proximity = 5 pipsđể nhận thông báo khi giá tiếp cận các mức quan trọng.
- Gắn SmartFibonacci vào biểu đồ 5 phút, đặt
- Ngữ cảnh khung thời gian cao hơn (giao dịch swing)
-
- Đặt
Use Higher Timeframe = truevà chọnHigher Timeframe = H4(hoặc Daily). - Các mức phản ánh swing H4 trong khi bạn giao dịch trên H1 hoặc M30 — phù hợp hơn với cấu trúc khung thời gian cao hơn.
- Sử dụng các mức mở rộng (127.2, 161.8) làm mục tiêu lợi nhuận cho giao dịch swing.
- Đặt
- Xác thực + hội tụ
-
- Kết hợp các mức SmartFibonacci với hỗ trợ/kháng cự hiện có, phá vỡ cấu trúc hoặc trung bình động để xác thực điểm vào.
- Sử dụng cảnh báo popup để định thời điểm vào lệnh hoặc ghi lại các tương tác để kiểm tra lại.
- Quy trình làm việc dựa trên cảnh báo
-
- Giữ chỉ báo bật trong khi theo dõi nhiều biểu đồ; nhận popup khi giá gần bất kỳ mức fib hiển thị nào đã cấu hình và hành động phù hợp.
Tóm tắt
Đánh giá của khách hàng
5 | 100 % | |
4 | 0 % | |
3 | 0 % | |
2 | 0 % | |
1 | 0 % |


