
Mô tả
---------------------------------------------------------------------------------------
Thông Báo Cập Nhật
Chúng tôi rất vui mừng thông báo một bản cập nhật quan trọng cho chỉ báo EnhancedSupportResistance của chúng tôi! Bản cập nhật này tập trung vào việc cải thiện xử lý các đối tượng biểu đồ, đảm bảo rằng các chú thích và bản vẽ tùy chỉnh của bạn vẫn được giữ nguyên.
Những điểm mới:
- Loại Bỏ Đối Tượng Có Chọn Lọc: Chỉ báo của chúng tôi hiện chỉ loại bỏ các đối tượng mà nó tạo ra, ngăn chặn việc xóa nhầm các đối tượng biểu đồ không liên quan.
- Trải Nghiệm Người Dùng Nâng Cao: Tận hưởng trải nghiệm mượt mà và đáng tin cậy hơn, với các chú thích và bản vẽ quan trọng của bạn không bị ảnh hưởng bởi các cập nhật của chỉ báo.
---------------------------------------------------------------------------------------
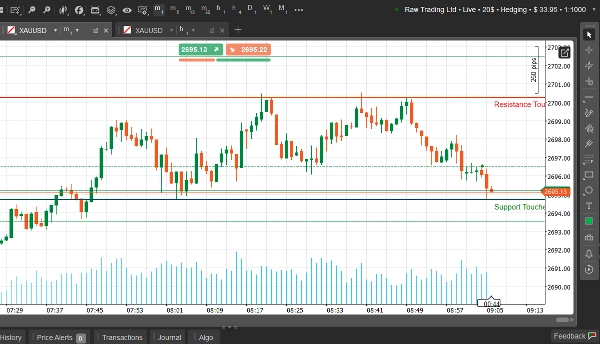
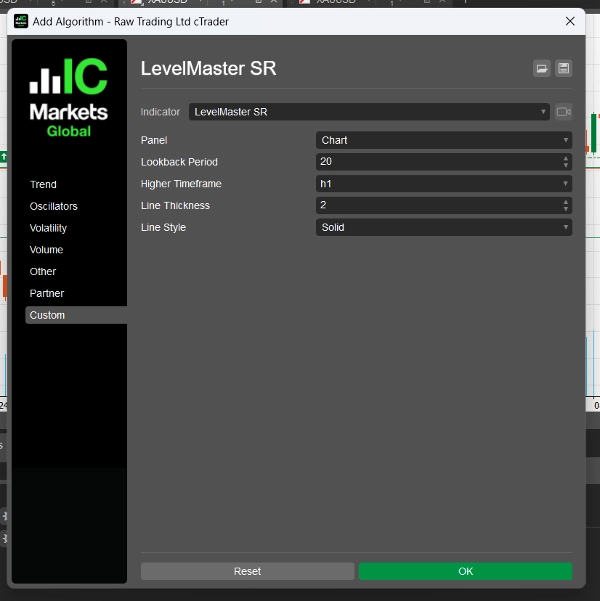
LevelMaster S/R - Làm Chủ Các Mức Quan Trọng Của Thị Trường
Mô Tả:
LevelMaster S/R là một chỉ báo giao dịch mạnh mẽ và được thiết kế chính xác nhằm mang lại lợi thế cho bạn bằng cách xác định chính xác các mức hỗ trợ và kháng cự quan trọng. Được xây dựng cho các nhà giao dịch ở mọi cấp độ, công cụ này phân tích hành động giá trên khung thời gian bạn chọn và làm nổi bật các vùng quan trọng nhất, giúp bạn đưa ra quyết định giao dịch thông minh với sự tự tin.
Dù bạn là nhà giao dịch lướt sóng, giao dịch trong ngày hay giao dịch swing, LevelMaster S/R cung cấp những hiểu biết bạn cần để điều hướng các thị trường biến động và tìm kiếm cơ hội sinh lời.
Tính Năng Chính:
🔥 Vùng Hỗ Trợ & Kháng Cự Chính Xác
- Tự động phát hiện các mức mạnh nhất dựa trên hành động giá, fractal và giá trị ATR.
⏱ Phân Tích Đa Khung Thời Gian
- Phân tích và hiển thị các mức chính từ bất kỳ khung thời gian nào bạn chọn, ngay trên biểu đồ của bạn.
📊 Hình Ảnh Tùy Chỉnh
- Điều chỉnh kiểu đường, màu sắc và độ dày để tích hợp liền mạch vào biểu đồ.
🔔 Cảnh Báo Thời Gian Thực
- Nhận thông báo qua âm thanh, email hoặc điện thoại khi giá tiếp cận các mức bạn chọn.
💡 Cài Đặt Thân Thiện Với Người Dùng
- Các tùy chọn nhập liệu trực quan giúp thiết lập nhanh chóng và dễ dàng, ngay cả với người mới bắt đầu.
Tại Sao Chọn LevelMaster S/R?
✔ Nâng Cao Quyết Định: Ngừng đoán mò và bắt đầu giao dịch với sự tự tin.
✔ Tiết Kiệm Thời Gian: Để chỉ báo làm phần việc nặng nhọc bằng cách xác định các vùng cho bạn.
✔ Hoạt Động Trên Mọi Thị Trường: Hoàn hảo cho Forex, Cổ phiếu, Hàng hóa và Tiền điện tử.
✔ Được Xây Dựng Bởi Nhà Giao Dịch, Dành Cho Nhà Giao Dịch: Thiết kế với các tính năng mà các nhà giao dịch thực sự cần.
Ai Nên Sử Dụng LevelMaster S/R?
- Nhà Giao Dịch Lướt Sóng: Xác định các vùng trong ngày cho các giao dịch nhanh.
- Nhà Giao Dịch Swing: Phát hiện các mức mạnh cho các biến động giá lớn hơn.
- Người Mới Bắt Đầu: Đơn giản hóa phân tích thị trường để dễ học hơn.
- Chuyên Gia: Nâng cao các chiến lược hiện có với dữ liệu đáng tin cậy.
Tóm tắt
Đánh giá của khách hàng
5 | 50 % | |
4 | 50 % | |
3 | 0 % | |
2 | 0 % | |
1 | 0 % |


