
Mô tả
ZigzagSR – Dao động Zigzag động với Hỗ trợ & Kháng cự Tự động
Mở khóa cấu trúc thị trường rõ ràng hơn và vùng vào lệnh chính xác với ZigzagSR, một chỉ báo cTrader mạnh mẽ mà:
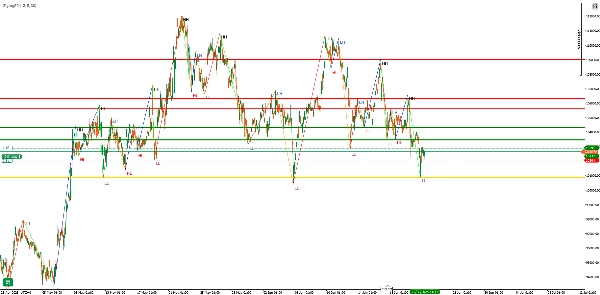
- Vẽ các dao động zigzag không tô lại (đỉnh cao hơn, đỉnh thấp hơn, đáy cao hơn, đáy thấp hơn) theo thời gian thực
- Tự động vẽ các mức hỗ trợ & kháng cự động dựa trên các dao động pivot gần nhất
- Gán nhãn cho mỗi điểm dao động (“HH”, “LH”, “HL”, “LL”) để dễ dàng nhận biết xu hướng
Tính Năng Chính
- Phát hiện Zigzag Thích ứng
-
- Các tham số có thể cấu hình Depth, Deviation, và Backstep để điều chỉnh độ nhạy với nhiễu thị trường
- Logic không tô lại đảm bảo các tín hiệu lịch sử vẫn ổn định sau khi được vẽ
- Mức SR Tự động
-
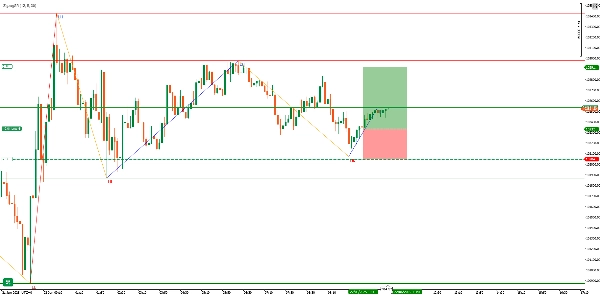
- Vẽ một đường Pivot tại điểm dao động hợp lệ cuối cùng (đường màu vàng)
- Làm nổi bật tối đa ba đỉnh Resistance (đường màu đỏ) và ba đáy Support (đường màu xanh lá) trước pivot
- Các đường cập nhật mượt mà khi các dao động mới hình thành, giữ cho biểu đồ của bạn gọn gàng
- Nhãn Hiển Thị Rõ Ràng
-
- “HH” (Đỉnh Cao Hơn) và “LH” (Đỉnh Thấp Hơn) cho các đỉnh giảm giá/cao hơn
- “HL” (Đáy Cao Hơn) và “LL” (Đáy Thấp Hơn) cho các đáy tăng giá/thấp hơn
- Các đoạn zigzag được mã màu:
-
- HH → Màu xanh chanh
- LH → Màu cam
- HL → Màu xanh dương
- LL → Màu đỏ
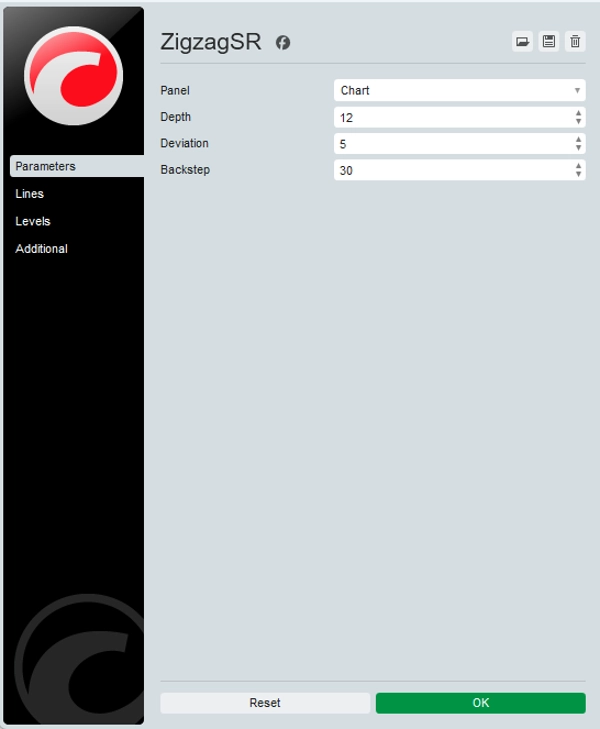
Đầu vào & Tùy chỉnh
Tham sốMặc địnhMô tả
Depth
12
Số thanh nhìn lại để xác định đỉnh/đáy cục bộ
Deviation
5
Di chuyển giá tối thiểu (tính bằng ticks) để tính là một dao động
Backstep
3
Số thanh để “quay lại” nhằm loại bỏ các pivot giả
Mẹo: Tăng Depth & Deviation trên các khung thời gian cao hơn để lọc nhiễu; giảm chúng trên M1/M5 để tăng độ nhạy.
Tại sao nên dùng ZigzagSR?
- Xác nhận Xu hướng: Phân biệt rõ ràng các dao động xung lực và các chuyển động điều chỉnh—lý tưởng cho nhà giao dịch swing và breakout.
- Vùng Vào Lệnh SR: Các mức được đánh dấu tự động giúp bạn xác định vùng vào lệnh, dừng lỗ và chốt lời mà không cần vẽ tay.
- Phát triển Chiến lược: Nhãn và đường thẳng cung cấp trực tiếp cho EAs/cBots hoặc hệ thống thủ công—xây dựng các thiết lập nhất quán, dựa trên quy tắc.
Cách Hoạt Động
- Bản đồ Cao/Thấp
-
- Quét các thanh trong
Depthkỳ để đánh dấu các điểm cực cục bộ (_highMap&_lowMap).
- Quét các thanh trong
- Xây dựng Dao động
-
- Luân phiên giữa trạng thái tăng và giảm, chỉ thêm các pivot quan trọng vào danh sách dao động.
- Gán Nhãn
-
- So sánh mỗi pivot với pivot trước đó để gán nhãn HH/LH hoặc HL/LL.
- Vẽ SR
-
- Xác định pivot mới nhất là “đường pivot,” sau đó vẽ ba đỉnh và đáy hợp lệ trước đó làm kháng cự/hỗ trợ.
- Hiển thị Zigzag
-
- Nối tất cả các điểm dao động bằng các đường xu hướng có màu và phủ nhãn văn bản lệch nhẹ để rõ ràng.
Trường hợp sử dụng & Mẹo
- Giao dịch Swing: Theo các xung đa thanh—vào lệnh khi giá hồi về đường pivot, nhắm mục tiêu mức SR tiếp theo.
- Xác nhận Breakout: Chờ giá phá vỡ đường kháng cự do ZigzagSR vẽ, sau đó xác nhận với khối lượng hoặc RSI.
- Kết hợp với Các Chỉ báo Khác: Kết hợp với các đường trung bình động, phân kỳ RSI hoặc hồ sơ khối lượng để tăng cường tín hiệu.
Bắt đầu trong vài giây:
- Cài đặt ZigzagSR từ cTrader Store.
- Kéo thả vào bất kỳ biểu đồ nào—không cần thư viện bên ngoài.
- Điều chỉnh ba tham số đầu vào theo khung thời gian và phong cách chiến lược bạn ưa thích.
Nâng cao phân tích biểu đồ của bạn với cấu trúc dao động thời gian thực và hỗ trợ & kháng cự động—hãy thử ZigzagSR ngay hôm nay!
Tóm tắt
Đánh giá của khách hàng
5 | 33 % | |
4 | 67 % | |
3 | 0 % | |
2 | 0 % | |
1 | 0 % |


