
说明
🌐 市场结构转变 – 专业市场结构振荡器
识别真实趋势方向。过滤噪音。自信交易。
市场结构转变 是为希望在所有市场条件下获得清晰、准确和可靠性的交易者打造的下一代结构性趋势振荡器。
该指标不依赖滞后的移动平均线或基于波动性的工具,而是聚焦于价格行为的核心:摆动高点 和 摆动低点。
其结果是一个清晰、高度响应的趋势模型,帮助您即时识别:
- 真实的市场偏向
- 结构转变
- 趋势延续力度
- 隐藏的动量变化
无论您是摆动交易、日内交易还是运行算法系统,市场结构转变都将专业级结构框架直接带入您的图表中。
🔥 为何市场结构重要
大多数指标是在价格已经移动之后进行分析的。
市场结构则不同——它衡量趋势发展的基础:
- 更高的高点 / 更高的低点 → 多头结构
- 更低的高点 / 更低的低点 → 空头结构
这揭示了市场正在构建的方向,而不仅仅是价格的瞬时表现。
市场结构转变自动化了整个过程,并将其转化为易于阅读的振荡器。
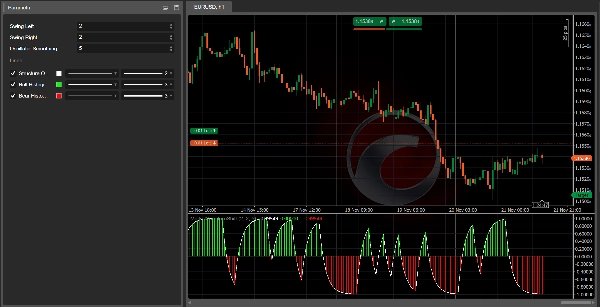
📊 指标显示内容
✔ 1. 结构振荡线(白色)
基于EMA平滑的趋势线,清晰显示主导结构:
- 高于0 → 多头结构
- 低于0 → 空头结构
- 接近0 → 结构不稳定或趋势转变
一眼即可看出市场的真实立场。
✔ 2. 多头柱状图(绿色)
显示多头结构内的强度和动量。
柱状图越强 = 上升压力越大。
非常适合确认多头建仓。
✔ 3. 空头柱状图(红色)
显示空头结构的动量和强度。
柱状图越强 = 下降趋势越强。
理想用于验证空头机会。
🎯 交易者如何使用(专业工作流程)
A. 趋势确认过滤器
仅在结构动量方向进行交易:
- 当振荡器 高于0 时做多
- 当振荡器 低于0 时做空
仅此简单规则即可消除许多错误建仓。
B. 结构反转检测
当振荡器穿越零线时,主要转变可见:
- 红 → 绿 = 新的多头结构
- 绿 → 红 = 新的空头结构
这在传统工具反应之前,提供了趋势转变的早期洞察。
C. 多时间框架优化
该指标在多时间框架工作流程中异常强大:
- 使用 H4/H1 作为 趋势框架
- 使用 M30/M15 作为 入场点
防止逆势交易并最大化准确性。
D. 与市场结构信号的协同
当与市场结构信号结合时,市场结构转变成为一个完整的交易系统,提供:
- 买入/卖出箭头
- 视觉转变标记
- 结构突破警报
它们共同创建了一个完整的自上而下基于结构的方法论。
⚙️ 适用于所有市场
✔ 外汇
✔ 指数
✔ 加密货币
✔ 贵金属
✔ 合成市场
✔ 期货(通过差价合约代理)
由于参数控制,具有高度适应性:
- 摆动检测
- 平滑强度
- 对结构变化的敏感度
📈 推荐设置
- 摆动左/右: 外汇和指数为2–3,加密货币为3–3
- 振荡器平滑: 5–8,平衡响应性
开箱即用,但完全可定制。
💬 加入我们的社区,获取免费工具和优化
点击我的个人资料中的链接,加入我们的交易社区,您将找到:
- 优化的参数集
- 额外工具
- 基于结构的策略
- AlgoTrend指标的独家资源
这是一个极佳的空间,帮助您发展系统并提升一致性。
摘要
客户评价
5 | 0 % | |
4 | 100 % | |
3 | 0 % | |
2 | 0 % | |
1 | 0 % |


