
Mô tả
Volume Bubbles – Chỉ báo tùy chỉnh cTrader
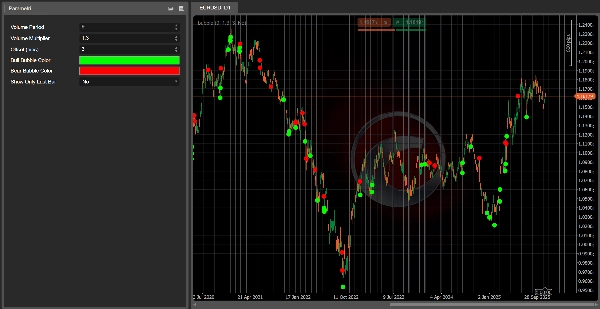
Volume Bubbles là một chỉ báo trực quan nhẹ nhưng mạnh mẽ cho cTrader, nổi bật các cây nến với khối lượng đặc biệt trực tiếp trên biểu đồ giá.
Thay vì nhìn chằm chằm vào biểu đồ khối lượng và cố đoán những thanh nào thực sự quan trọng, công cụ này tự động phát hiện khi khối lượng của cây nến hiện tại cao hơn đáng kể so với trung bình gần đây và vẽ một bong bóng (biểu tượng hình tròn) trên thanh đó:
- Đối với nến tăng, một bong bóng được vẽ dưới mức thấp của cây nến.
- Đối với nến giảm, một bong bóng được vẽ trên mức cao của cây nến.
Điều này giúp rất dễ dàng phát hiện các động thái đỉnh điểm tiềm năng, các khu vực có sự quan tâm mạnh mẽ từ các nhà đầu tư lớn, hoặc các điểm có thể là sự kiệt sức trong xu hướng.
Tính năng chính
- ✅ Phát hiện nến có khối lượng cao sử dụng Trung bình Động của khối lượng tick
- ✅ Vẽ bong bóng rõ ràng trên biểu đồ (không cần cửa sổ phụ thêm)
- ✅ Màu sắc khác nhau cho nến tăng và nến giảm có khối lượng tăng đột biến
- ✅ Có thể điều chỉnh độ lệch tính bằng pip để đặt bong bóng cách xa cây nến
- ✅ Tùy chọn chỉ hiển thị bong bóng trên thanh mới nhất (cho giao dịch thời gian thực)
Đầu vào / Tham số
- Chu kỳ khối lượng – Số thanh được sử dụng để tính trung bình động khối lượng.
- Bội số khối lượng – Bao nhiêu lần trên khối lượng trung bình một thanh phải đạt để kích hoạt bong bóng.
- Độ lệch (pip) – Khoảng cách giữa bong bóng và mức cao/thấp của cây nến.
- Màu bong bóng nến tăng – Màu của bong bóng trên các cây nến tăng.
- Màu bong bóng nến giảm – Màu của bong bóng trên các cây nến giảm.
- Chỉ hiển thị thanh cuối – Nếu đúng, chỉ hiển thị bong bóng trên thanh hiện tại đang hoạt động.
Cách sử dụng
Thêm Volume Bubbles vào biểu đồ của bạn và sử dụng nó như một bộ lọc trực quan để:
- Xác nhận các đột phá được hỗ trợ bởi khối lượng mạnh
- Phát hiện các khả năng đảo chiều hoặc nến kiệt sức
- Xác định các vùng mà các nhà đầu tư lớn có thể đang hoạt động
Nó không phải là một hệ thống giao dịch độc lập, nhưng là một công cụ hỗ trợ tuyệt vời cho bất kỳ chiến lược hành động giá hoặc theo xu hướng nào quan tâm đến khối lượng.
👉 Tham gia tại đây: Algotrendit Volume Bubbles
Bên trong server bạn sẽ tìm thấy:
- Hỗ trợ cho chỉ báo này và các cBots/chỉ báo khác
- Thảo luận chiến lược và ý tưởng tối ưu hóa
- Cập nhật, tin tức và các công cụ tương lai tôi phát hành
Tóm tắt
Key features include adjustable parameters such as the volume period for averaging, volume multiplier threshold, bubble offset in pips, and customizable colors for bullish and bearish volume spikes. Users can also choose to display bubbles only on the latest bar for real-time trading. The indicator integrates directly on the price chart without requiring additional subwindows.
Volume Bubbles serves as a visual filter to confirm breakouts supported by strong volume, spot possible reversals or exhaustion candles, and identify zones of significant market activity. It complements price action and trend-following strategies by providing volume-based insights across various markets including forex, indices, commodities, stocks, and cryptocurrencies.
Đánh giá của khách hàng
5 | 0 % | |
4 | 100 % | |
3 | 0 % | |
2 | 0 % | |
1 | 0 % |


![Logo "[Stellar Strategies] Ultimate Trend & Momentum Dashboard"](https://cdn.ctrader.com/image/webp/e9a9c9e9-4b6c-4bc0-9988-4c4768a23b6c_30290)


