
Mô tả
Index Hunter: Tổng quan
Index Hunter là một chỉ báo kỹ thuật chuyên biệt và hệ thống hỗ trợ quyết định được thiết kế chủ yếu cho các chỉ số có biến động cao như US30 (Dow Jones) và NAS100 (Nasdaq). Khác với các chỉ báo tiêu chuẩn chỉ hiển thị dữ liệu quá khứ, Index Hunter tập trung vào "Dự đoán Vector"—cố gắng dự báo vị trí giá có khả năng đạt tới sau 4 nến dựa trên vận tốc hiện tại (độ dốc) trên nhiều khung thời gian.
1. Cơ chế chính (Cách hoạt động)
A. Bộ dự báo "Vector"
Đây là trái tim của công cụ. Nó không chỉ xem giá hiện tại; nó tính toán tốc độ thay đổi (Độ dốc) trên các khung thời gian M5, M15 và H1 để vẽ "Đường đi Tương lai" trên biểu đồ của bạn.
- Cơ chế: Nó tính trung bình có trọng số của động lượng từ các khung thời gian khác nhau để dự báo 4 điểm (P1, P2, P3, P4) trong tương lai.
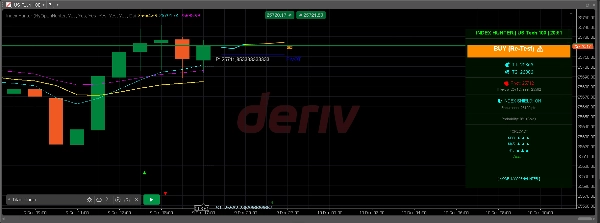
- Hình ảnh: Bạn sẽ thấy một đường màu (Xanh lơ -> Vàng -> Cam) kéo dài sang bên phải của giá, thể hiện quán tính của thị trường.
- Đường ma: Nó cũng ghi nhớ dự đoán trước đó (Đường ma) để bạn có thể xem liệu thị trường có tôn trọng các dự báo trước đó của thuật toán (một "kiểm tra thực tế").
B. Hệ thống hình ảnh đa lớp
Nó tự động phủ lên các mức quan trọng của tổ chức:
- Điểm Pivot (Linh hoạt): Tự động tính toán các mức Pivot, R1/S1 và R2/S2 dựa trên khung thời gian có thể chọn (H12, Hàng ngày, Ngày 2 hoặc Ngày 3).
- Mức tâm lý: Vẽ "Đường tâm lý" tại mỗi khoảng 100 điểm (ví dụ: 34000, 34100), thường đóng vai trò như các vùng hút cho các chỉ số.
- Cao/Thấp hàng ngày: Đánh dấu phạm vi ngày trước để hiển thị vùng bứt phá hoặc từ chối.
- Fractals: Xác định đỉnh và đáy cục bộ với mũi tên (▲ ▼) để đặt điểm vào lệnh/dừng lỗ chính xác.
C. Logic "Độ tin cậy" & Tính khả thi
Công cụ không chỉ đưa ra tín hiệu; nó còn đánh giá tín hiệu đó.
- Tính toán: Nó đo khoảng cách đến mục tiêu lợi nhuận của bạn và so sánh với năng lượng hiện tại của thị trường (ATR - Phạm vi thực trung bình).
- Kết quả:
-
- NÓNG (>80%): Động lượng mạnh + Khoảng cách mục tiêu hợp lý.
- ẤM (50-80%): Thiết lập vừa phải.
- LẠNH (<50%): Thị trường cho rằng khả năng đạt mục tiêu thấp (ví dụ: mục tiêu quá xa so với biến động hiện tại).
D. Cơ chế "Khiên" tài khoản
Nó bao gồm một bộ quản lý rủi ro thụ động trên bảng điều khiển:
- Chỉ số chịu đựng: Tính toán số "điểm" thị trường có thể di chuyển ngược lại bạn trước khi tài khoản của bạn gặp nguy hiểm, dựa trên số dư và kích thước lô tối thiểu của bạn.
- Trạng thái: Hiển thị "🛡️ KHIÊN CHỈ SỐ: BẬT" nếu tài khoản của bạn an toàn so với biến động hiện tại (ATR), hoặc "⚠️ KÝ QUỸ THẤP" nếu biến động quá cao so với số dư của bạn.
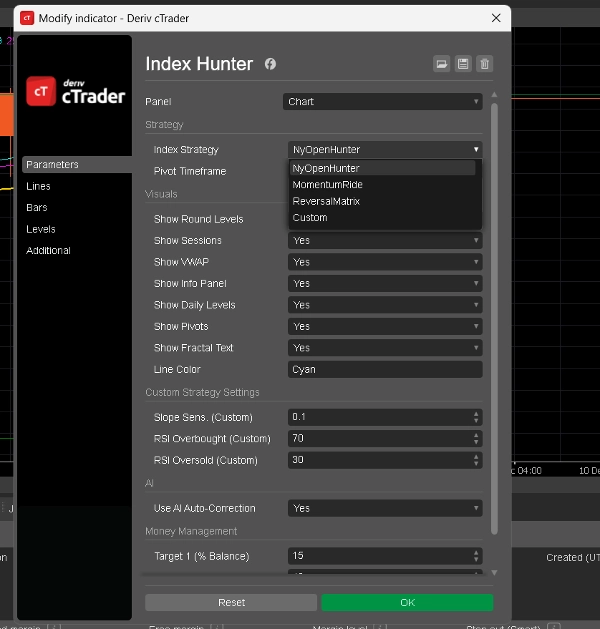
2. Các chế độ có sẵn (Chiến lược)
Bạn có thể chuyển đổi giữa các chế độ này trong cài đặt chỉ báo (
Chiến lược Chỉ số
tham số). Mỗi chế độ thay đổi cách AI diễn giải thị trường.
1. Chế độ: NyOpenHunter (Scalper New York)
- Phù hợp nhất cho: 2-3 giờ đầu hỗn loạn của Phiên Mở cửa Thị trường Mỹ.
- Logic:
-
- Thời gian hoạt động: 13:00 - 17:00 UTC (khoảng).
- Kích hoạt: Nó tìm Độ dốc M5 lớn hơn 0.1 (hoặc nhỏ hơn -0.1).
- Triết lý: "Bắt lấy sự bùng nổ." Nó chờ đợi sự bùng nổ khối lượng ban đầu khi chuông NY vang lên và báo hiệu để đi theo sóng cụ thể đó.
- Tâm lý bảng điều khiển: Hiển thị "NY OPEN MUA 🚀" hoặc "NY OPEN BÁN 🔻".
2. Chế độ: MomentumRide (Theo xu hướng)
- Phù hợp nhất cho: Xu hướng mạnh và bền vững ngoài giờ mở cửa.
- Logic:
-
- Kích hoạt: Yêu cầu Độ dốc M5 mạnh hơn (> 0.2) so với chế độ NY.
- Triết lý: "Đừng bị chặt chém." Nó bỏ qua các chuyển động yếu và chỉ báo hiệu khi thị trường di chuyển với sự thuyết phục đáng kể.
- Tâm lý bảng điều khiển: Hiển thị "ĐỘNG LỰC TĂNG 🟢" hoặc "ĐỘNG LỰC GIẢM 🔴".
3. Chế độ: ReversalMatrix (Phản xu hướng)
- Phù hợp nhất cho: Thị trường đi ngang hoặc bắt đỉnh/đáy.
- Logic:
-
- Kích hoạt: Sử dụng RSI (Chỉ số sức mạnh tương đối).
-
- Tín hiệu bán: RSI > 75 (Quá mua).
- Tín hiệu mua: RSI < 25 (Quá bán).
- Triết lý: "Phản ứng với các cực điểm." Nó xác định khi dây cao su bị kéo căng quá mức và có khả năng bật ngược lại.
- Tâm lý bảng điều khiển: "QUÁ MUA (SẮP BÁN)" hoặc "QUÁ BÁN (SẮP MUA)".
4. Chế độ: Tùy chỉnh (Người dùng định nghĩa)
- Phù hợp nhất cho: Người dùng nâng cao muốn tùy chỉnh bot.
- Logic: Cho phép bạn đặt ngưỡng riêng cho Độ nhạy Độ dốc và mức RSI trong cài đặt.
-
- Ví dụ: Bạn có thể tạo một chiến lược lai chỉ mua khi Độ dốc > 0.05 VÀ RSI < 40.
3. Bảng "Thông tin" (Hiển thị thông tin)
Bảng hiển thị bên phải biểu đồ tổng hợp tất cả dữ liệu này:
- Tiêu đề: Hiển thị chế độ hiện tại và ký hiệu.
- Ưu tiên: Định hướng AI chính (ví dụ: "MUA 34150 ▲").
- Mục tiêu (T1, T2): Mục tiêu lợi nhuận động được tính dựa trên tỷ lệ phần trăm tài khoản và biến động.
- Dự báo: Phân tích tuần tự các xu hướng M30, M45 và H1 (ví dụ: "M30: ▲ ▲ ▲" nghĩa là sự đồng thuận mua mạnh).
- Xác suất: Điểm tin cậy của AI (Nóng/Ấm/Lạnh).
Tóm tắt
Key features include an automatic overlay of institutional levels such as pivot points (with selectable timeframes), psychological price levels at 100-point intervals, previous day’s high/low, and fractals marking local tops and bottoms. It incorporates a confidence grading system (Hot, Warm, Cold) based on momentum strength and volatility relative to profit target distance.
Index Hunter includes a risk management "Shield" that assesses account safety by calculating potential adverse market moves against account balance and lot size, displaying status alerts accordingly.
The indicator offers four operational modes: NyOpenHunter (New York market open scalping), MomentumRide (trend following), ReversalMatrix (counter-trend using RSI), and a Custom mode for user-defined slope and RSI thresholds. A comprehensive info panel consolidates mode, bias, dynamic targets, trend forecasts, and confidence scores for decision support.
Đánh giá của khách hàng
5 | 67 % | |
4 | 33 % | |
3 | 0 % | |
2 | 0 % | |
1 | 0 % |


![Logo "High-Low Divergence [Iridio Capital]"](https://cdn.ctrader.com/image/webp/443c4661-7abb-40f1-842f-4b6ec560649b_40914)


