
Candles_Painter
指标
3 购买
版本 1.0, Aug 2025
Windows 版、Mac 版
5.0
评价:2
说明
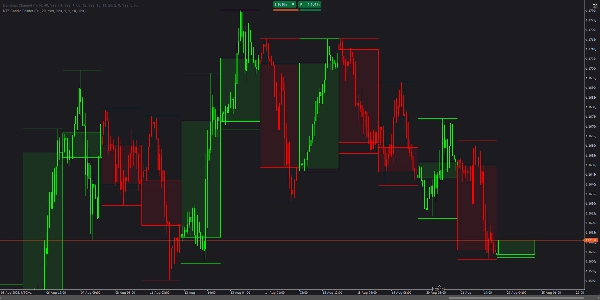
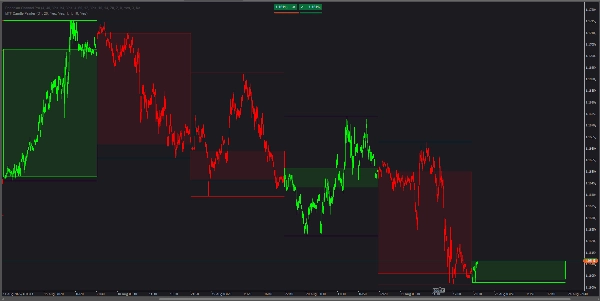
MTF Candle Painter 直接在您当前的图表上叠加 更高时间框架 (HTF) 的背景。它根据包含的 HTF 蜡烛的方向为活动时间框架上的每个柱子着色,并绘制一个填充的 HTF 实体矩形(仅开盘-收盘,无影线)以及可选的 HTF 高/低 线。独立的多头/空头颜色和可调节的填充不透明度使偏向一目了然,清晰易读。
主要特点
- 多时间框架柱子着色: 所有包含在 HTF 蜡烛内的柱子继承其多头/空头颜色。
- HTF 实体叠加: HTF 开盘和收盘之间的矩形;无中间影线以保持清晰。
- 独立多头/空头样式: 多头和空头 HTF 蜡烛的独立轮廓和填充颜色。
- 可调节不透明度: 设置填充透明度(默认 10%),以便与价格整洁叠加。
- HTF 高/低线: 可选,线条粗细可配置。
- 回溯控制: 选择渲染多少最近的 HTF 蜡烛(默认 20)。
- 轻量级: 使用原生图表对象;快速且不干扰。
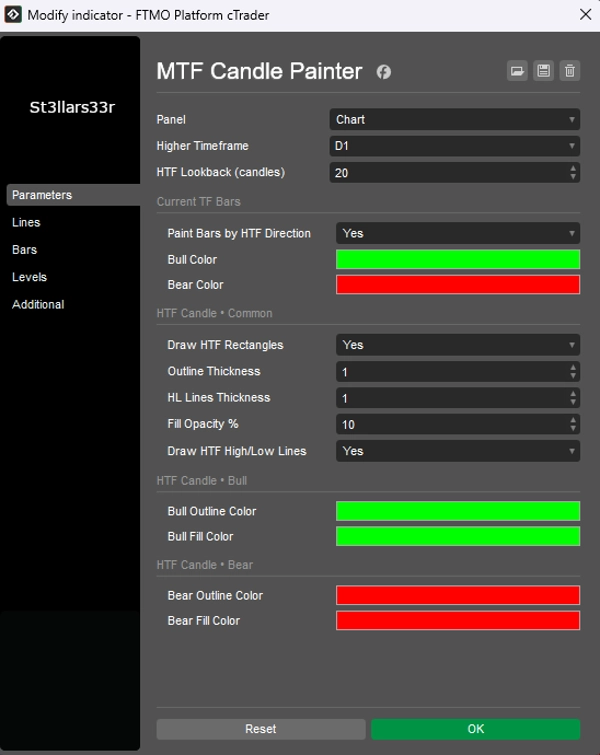
参数
核心
更高时间框架– 要叠加的 HTF(例如,D1,H4,W1)。HTF 回溯(蜡烛数)– 要绘制的 HTF 蜡烛数量(默认 20)。
当前时间框架柱子
按 HTF 方向着色柱子– 按包含的 HTF 蜡烛为当前时间框架柱子着色(是/否)。多头颜色/空头颜色– 当前时间框架柱子的颜色。
HTF 蜡烛 • 通用
绘制 HTF 矩形– 显示 HTF 实体矩形(默认 是)。轮廓粗细– HTF 实体轮廓的粗细。高低线粗细– HTF 高/低线的粗细。填充不透明度 %– HTF 实体填充的透明度(默认 10%)。绘制 HTF 高/低线– 切换 HTF 高/低线(是/否)。
HTF 蜡烛 • 多头
多头轮廓颜色– 多头 HTF 蜡烛的轮廓颜色。多头填充颜色– 多头 HTF 蜡烛的填充颜色。
HTF 蜡烛 • 空头
空头轮廓颜色– 空头 HTF 蜡烛的轮廓颜色。空头填充颜色– 空头 HTF 蜡烛的填充颜色。
适用对象
- 日内交易者和剥头皮交易者 需要连续的 HTF 偏向而无需切换图表。
- SMC/Wyckoff 实践者 在执行低时间框架交易时依赖更高时间框架结构。
- 任何想要在其工作时间框架上叠加 清晰、直观的 HTF 背景 的人。
摘要
AI 摘要
Candles_Painter is a multi-timeframe indicator designed to overlay higher timeframe (HTF) candle context onto a lower timeframe chart. It visually colors each bar on the active timeframe according to the bullish or bearish direction of the enclosing HTF candle. The indicator draws filled rectangles representing the HTF candle bodies (open to close, excluding wicks) with customizable fill opacity and separate colors for bullish and bearish candles. Optional HTF high and low lines can also be displayed with adjustable thickness.
Key features include:
- Coloring of all bars within an HTF candle by its direction.
- HTF body overlays for clear visual bias.
- Independent styling for bullish and bearish HTF candles.
- Adjustable transparency for neat integration with price data.
- Configurable lookback period for the number of HTF candles shown.
- Lightweight implementation using native chart objects for performance.
Users can customize parameters such as the higher timeframe to overlay (e.g., daily, 4-hour), colors for bars and HTF candles, opacity, and whether to display HTF high/low lines. This tool is suited for intraday traders, scalpers, and market structure practitioners who require continuous HTF context without switching charts.
指标配置
客户评价
5.0
评价:2
5 | 100 % | |
4 | 0 % | |
3 | 0 % | |
2 | 0 % | |
1 | 0 % |
客户评价
September 1, 2025
The log becomes easier to read, but a manual check is still part of the process.
August 27, 2025
A few ugly trades are useful in the sample, and it makes the setup easier to question.
讨论
常见问答
cTrader Store 提供的所有产品,包括交易机器人、指标和插件,均由第三方开发者提供,仅供信息参考和技术访问之用。cTrader Store 并非经纪商,不提供投资建议、个人推荐或任何未来业绩保证。
该作者的其他作品


价格
注册日期 26/05/2025
406.45M
交易量
60.92K
盈利点数
15
销售
1.42K
免费安装