
Market Entropy
指标
107 下载
版本 1.0, Aug 2025
Windows 版、Mac 版
说明
市场熵 是一个双重指标(振荡器 + 可选价格叠加),用于量化市场组织并标记 秩序 → 过渡 → 混沌 之间的体制转变。它添加了第二条线,趋势度 (DC),以区分 真实趋势 与 波动性挤压。
工作原理:
- 仅使用 OHLCV 组件: DC(方向一致性),FlipRate(符号翻转),Volatility_n(ATR/ATRlong),VolumeTurb(ΔVolume 的标准差)。
- 原始熵:
E0 = 0.5*(1-DC) + 0.3*(FlipRate*VolN) + 0.2*VolumeTurb)。 - 反挤压项在 ATR 压缩期间降低 E → 最终 熵 ∈ [0..1] 并进行 EMA 平滑。
- 标记:
-
- CRYSTAL — 低于 LowThr 的交叉(秩序出现:趋势或突破前挤压)。
- DISSOLVE — 高于 HighThr 的交叉(秩序破裂:混沌/趋势衰退)。
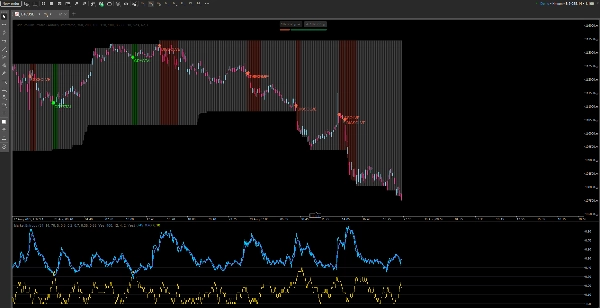
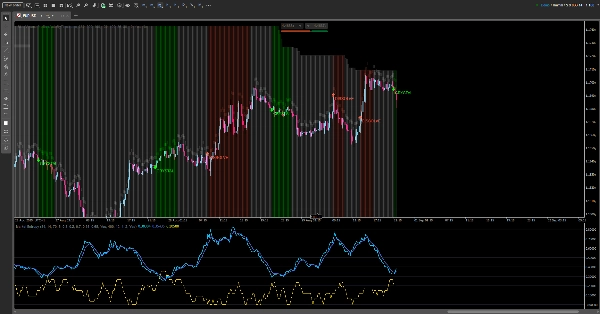
你看到的内容:
- 面板中: 熵,熵(EMA),趋势度 (DC),低/高阈值,区域背景。
- 图表上(可切换):状态颜色条,细长的 带状物 位于高点上方,以及 CRYSTAL/DISSOLVE 标记。
阅读指南:
- E < LowThr → 秩序:
-
- 伴随 高 DC → 有组织的 趋势;
- 伴随 低 ATR → 挤压(预期突破)。
- LowThr…HighThr → 过渡:结构形成;等待结果。
- E > HighThr → 混沌:不确定性 / 趋势消退;避免天真的持续入场。
操作手册:
- 挤压 → CRYSTAL → 突破/回测 — 交易突破。
- 趋势 → DISSOLVE — 分批退出或收紧风险。
摘要
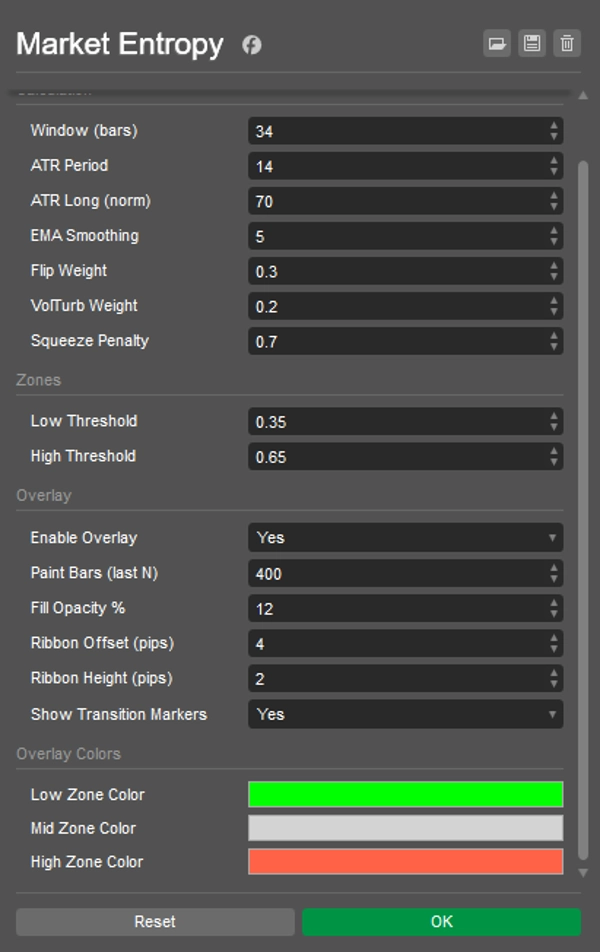
指标配置
客户评价
0.0
评价:0
客户评价
该产品尚无评价。已经试过了?抢先告诉其他人!
讨论
常见问答
cTrader Store 提供的所有产品,包括交易机器人、指标和插件,均由第三方开发者提供,仅供信息参考和技术访问之用。cTrader Store 并非经纪商,不提供投资建议、个人推荐或任何未来业绩保证。


价格
注册日期 26/05/2025
388.58M
交易量
60.75K
盈利点数
15
销售
1.41K
免费安装