
TrendStrengthSignals
指标
版本 1.0, Aug 2025
Windows 版、Mac 版
5.0
评价:1
说明
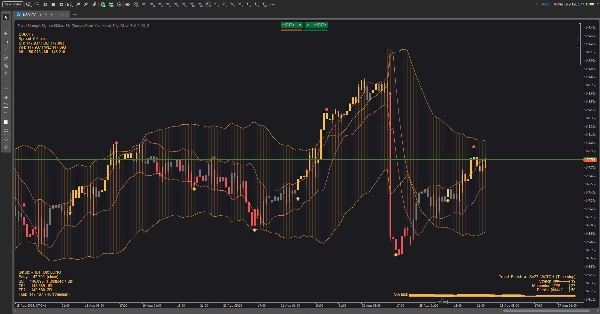
一个用于趋势交易的视觉工具包,将波动率包络线与周期感知通道相结合,一目了然地显示状态、时机和风险。它设计为在任何背景(浅色/深色)下都易于阅读,并保持屏幕整洁,同时仍为您提供“下一步该做什么”的提示。
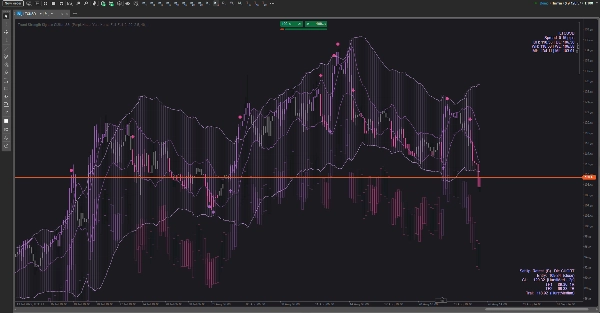
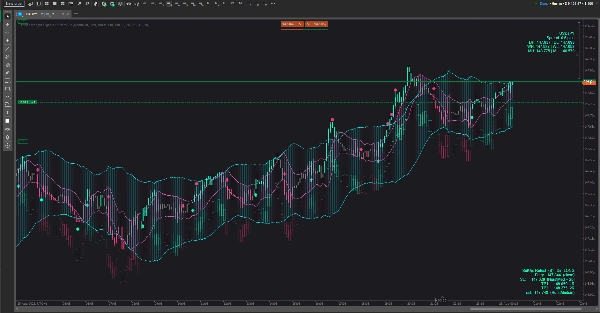
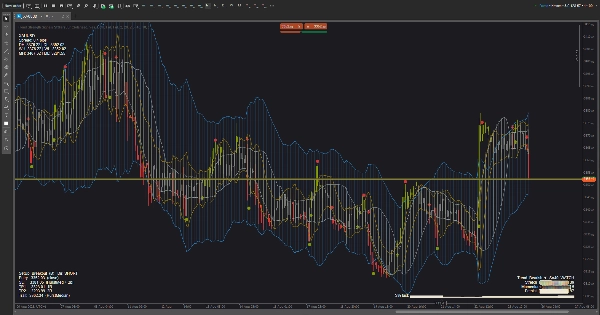
图表上显示的内容
- 云层(可切换):
-
- 一个 波动率云,随市场活动扩展/收缩。
- 一个 周期云,跟踪价格的滚动节奏。
- 您可以显示其中之一、两者或都不显示。
- 信号:不显眼的上下箭头表示潜在趋势转变;小点表示止盈提示。
- 趋势强度HUD(三种样式):
-
- 轻量 — 一个紧凑的状态标签。
- 专业 — 一个带有三个计量器(伸展、动量、持久性)和迷你历史火花线的小仪表盘。
- 带状 — 价格附近的柔和条,其强度随趋势强度变化。
- 风险HUD:提出方向、保护止损区域、两个分层利润目标和一个可选的追踪想法。它可以放置在您选择的任何角落,并随着K线的变化更新。
- 市场HUD:显示符号和点差,以及日/周/月的高低参考,让您始终了解自己在更大地图中的位置。
- 主题:为浅色和深色图表(以及自定义模式)精心挑选的配色方案。所有图形元素——包括HUD和信号——都遵循当前主题。
如何使用(实用而非技术)
- 选择您的云层视图:
-
- 使用 波动率云查看挤压和扩展。
- 使用 周期云判断“边缘”与“中间”旋转。
- 如果您想要上下文加时机,可以同时使用两者。
- 读取趋势强度:
-
- 当状态升级为 保持时,偏向当前方向交易;当降至 观察时,减少激进;如果显示 退出,避免新交易或收紧风险。
- 在 专业模式下,上升的计量器和上升的火花线表示质量改善;计量器减弱则需管理降低风险。
- 根据价格与云层的关系把握入场时机:
-
- 压缩后的突破、对云层的适度回调后的重新入场,或从外缘反弹是主要模式。
- 如果在K线中段出现早期箭头后消失,若您偏好减少虚假信号,请等待K线收盘确认。
- 用风险HUD管理交易:
-
- 将保护止损大致放置在HUD突出显示的最近结构边界之外。
- 在TP1处分批退出,让剩余部分瞄准TP2或跟随建议的追踪线。
- 如果趋势强度从强变弱,考虑提前退出。
- 情境过滤器:
-
- 当云层稀薄且波动剧烈,或强度状态处于退出时,避免入场。
- 当强度增强、云层倾斜且价格与边缘清晰互动时,优先考虑交易。
自定义
- 切换HUD角落、可视化样式和颜色主题以匹配您的工作空间。
- 适合浅色主题的配色方案确保白色背景上的文本可见;海洋/森林/日落调色板增加细微对比而无眩光。
它不是自动交易黑盒子
这不是一个黑盒自动交易系统。它是一个决策辅助工具:它框定趋势质量,提出合理的风险位置,并突出高概率时刻——但您始终掌控全局。
摘要
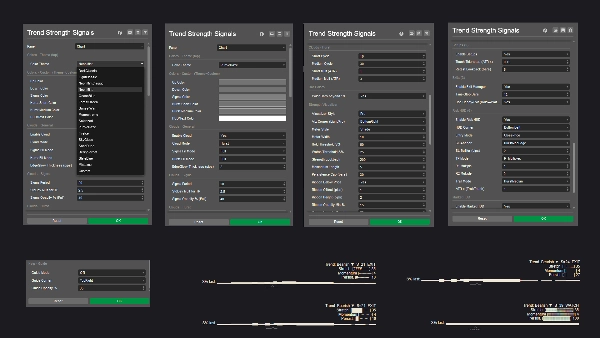
指标配置
客户评价
5.0
评价:1
5 | 100 % | |
4 | 0 % | |
3 | 0 % | |
2 | 0 % | |
1 | 0 % |
客户评价
September 2, 2025
The reason it feels usable is direction is easier to respect, and a 1R exit plan makes review easier.
讨论
常见问答
cTrader Store 提供的所有产品,包括交易机器人、指标和插件,均由第三方开发者提供,仅供信息参考和技术访问之用。cTrader Store 并非经纪商,不提供投资建议、个人推荐或任何未来业绩保证。


!["High-Low Divergence [Iridio Capital]" 标识](https://cdn.ctrader.com/image/webp/443c4661-7abb-40f1-842f-4b6ec560649b_40914)


价格
注册日期 26/05/2025
380.55M
交易量
60.65K
盈利点数
14
销售
1.38K
免费安装