
Donchian Channel Pro
指标
版本 1.0, Aug 2025
Windows 版、Mac 版
4.5
评价:2
说明
如何使用唐奇安(突破)策略进行交易
- 买入 当价格突破N周期高点(上轨)时。
- 卖出 当价格突破N周期低点(下轨)时。
- 持有 持仓,直到趋势持续;在相反突破或通过移动止损时退出。
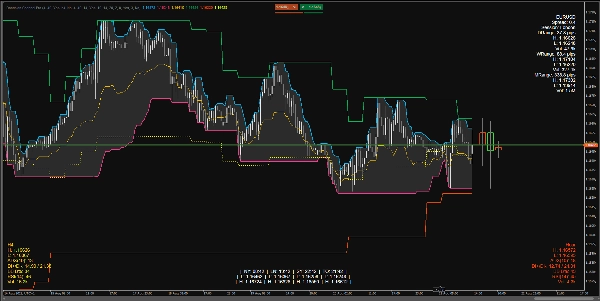
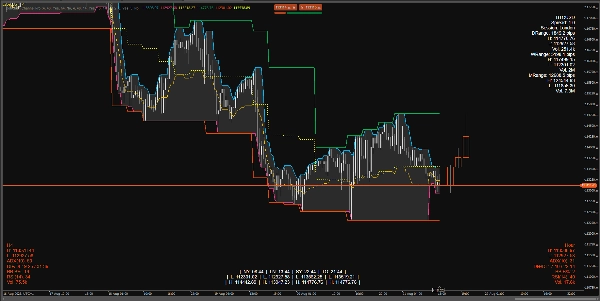
指标在图表上的显示内容
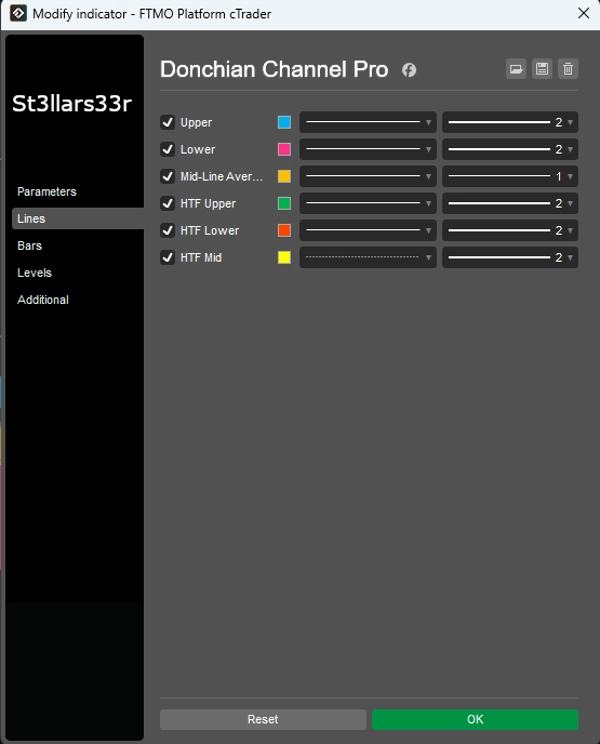
当前时间框架(TF)上的唐奇安:
- 上轨:上轨通道柱中的最高价格。
- 下轨:下轨通道柱中的最低价格。
- 中轨:上轨和下轨之间的中点。
高时间框架叠加:来自更高时间框架的唐奇安线叠加在图表上:
- 高时间框架上轨, 高时间框架下轨, 高时间框架中轨
- 高时间框架蜡烛HUD:表示更高时间框架蜡烛的矩形,锚定在当前时间框架最后一根柱的右侧。
底部/顶部的HUD(抬头显示):
- 右上角:符号信息面板 + 日/周/月波动范围。
- 左下角:高时间框架HUD(更高时间框架的指标)。
- 右下角:中间时间框架HUD(中间时间框架的指标)。
- 底部中间:会话时钟 + 每个会话的高/低(持续显示)。
每个HUD显示的内容
右上角(右上)
- 符号名称
- 点差:以点数计的点差。
- 会话:当前活跃会话(基于指定时间)。
- 日/周/月波动范围:以点数计的日/周/月波动范围。
- 高/低/成交量:相应周期的最高/最低价及总成交量。
左下角(左下)— 高时间框架HUD
- 时间框架名称(例如,H4,D1等)
- 高/低:最后(或当前)高时间框架柱的最高/最低价。
- ADX(n), DI+/DI-:趋势指标。
- 布林带B%:当前价格相对于高时间框架布林带的位置(0接近下轨,100接近上轨)。
- RSI(n)
- 成交量:高时间框架的成交量。
- HUD颜色:
-
- 绿色:波动范围向上扩展(DI+和ADX上升)。
- 红色:向下压力增加(DI-上升)。
- 黄色:中性/未定义。
右下角(右下)— 中间时间框架HUD
- 与高时间框架HUD相同,但针对中间时间框架(中间时间框架)。
底部中间(底部中央)— 时钟 + 会话高/低
- 时间 在纽约、伦敦、悉尼、多伦多。
- 低/高 每个会话的高低价。
- 持续逻辑:当会话不活跃时,显示上一个完成会话的高低价;当新会话开始时,数值重置并重新计算。
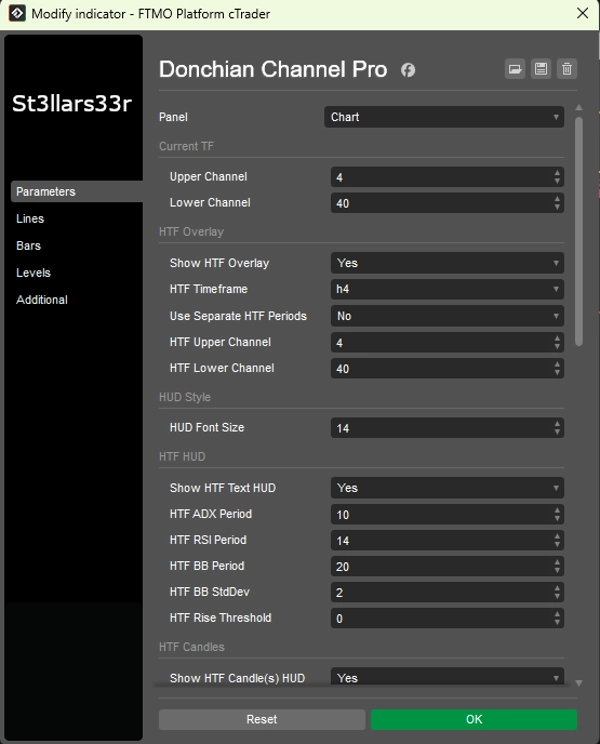
参数及其使用方法
组:当前时间框架(当前唐奇安)
- 上轨通道:上轨通道的柱数。数值越大,更新越不频繁,线条越平滑。
- 下轨通道:下轨通道的柱数。
组:高时间框架叠加(高时间框架唐奇安叠加)
- 显示高时间框架叠加:启用图表上的高时间框架线条。
- 高时间框架:选择更高的时间框架(例如,Hour4)。
- 使用独立的高时间框架周期:如果为真,高时间框架的上轨/下轨使用自己的参数;如果为假,则使用当前的上轨/下轨。
- 高时间框架上轨通道:高时间框架上轨通道的长度。
- 高时间框架下轨通道:高时间框架下轨通道的长度。
组:HUD样式
- HUD字体大小:所有HUD(右上角、左下角、右下角、底部中间)的字体大小。
组:高时间框架HUD(左下角)
- 显示高时间框架文本HUD:显示高时间框架的文本HUD。
- 高时间框架ADX周期:ADX/DI周期。数值越大,平滑度越高,噪音越少,但响应越慢。
- 高时间框架RSI周期:RSI周期。
- 高时间框架布林带周期:布林带周期。
- 高时间框架布林带标准差:布林带的标准差乘数(经典为2.0)。
- 高时间框架上升阈值:对上升指标的敏感度(影响HUD颜色)。
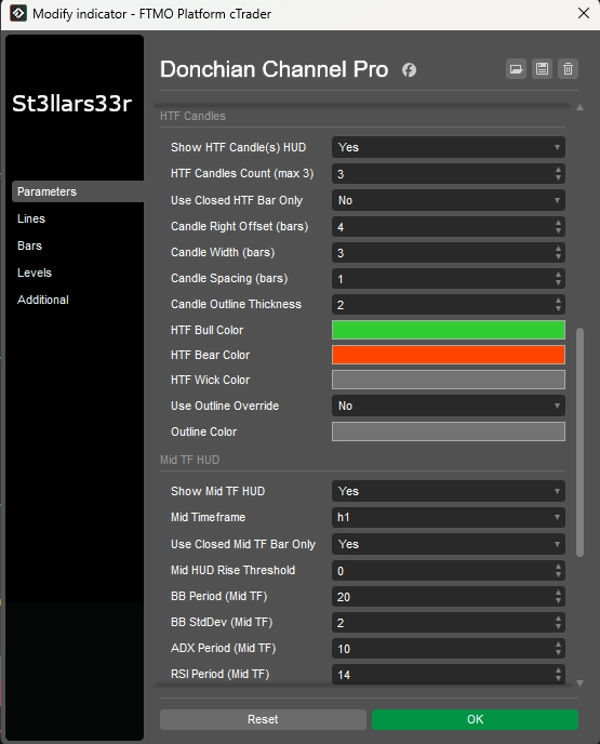
组:高时间框架蜡烛(右侧,靠近最后一根柱)
- 显示高时间框架蜡烛HUD:在右侧显示高时间框架蜡烛。
- 高时间框架蜡烛数量(最多3根):高时间框架蜡烛的数量(1-3根)。
- 仅使用已关闭的高时间框架柱:如果为真,仅使用已关闭的高时间框架蜡烛(数值稳定)。如果为假,则包括当前未关闭的蜡烛。
- 蜡烛右侧偏移(柱数):当前时间框架最后一根柱的右侧偏移量(以柱数计,锚点)。
- 蜡烛宽度(柱数):蜡烛矩形的宽度,单位为当前时间框架的柱数。
- 蜡烛间距(柱数):蜡烛之间的间隙。
- 蜡烛轮廓厚度:蜡烛轮廓的厚度。
- 高时间框架多头颜色 / 高时间框架空头颜色:多头/空头蜡烛的颜色。
- 高时间框架蜡烛影线颜色:影线的颜色。
- 使用轮廓覆盖:如果为真,蜡烛实体用轮廓色绘制(轮廓颜色),不填充多头/空头颜色。
- 轮廓颜色:当使用轮廓覆盖为真时的轮廓颜色。
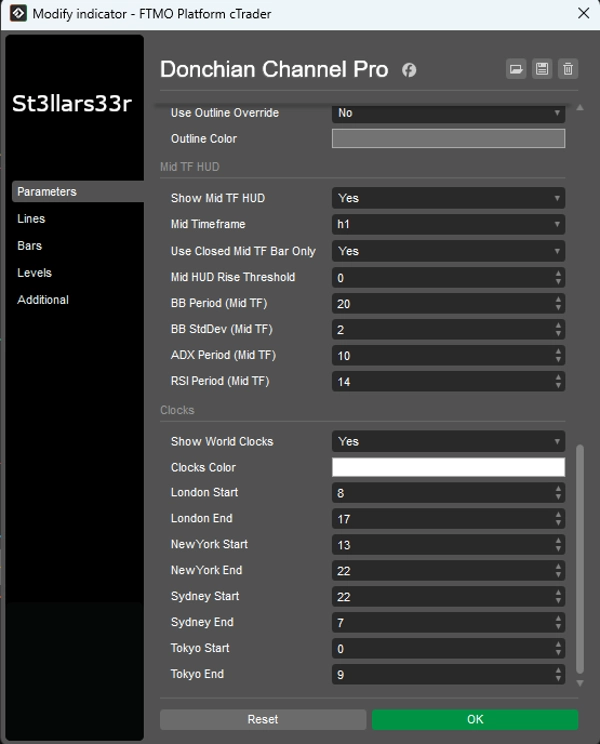
组:中间时间框架HUD(右下角)
- 显示中间时间框架HUD:启用中间时间框架的HUD。
- 中间时间框架:选择中间时间框架(例如,Minute15)。
- 仅使用已关闭的中间时间框架柱:与高时间框架相同,但针对中间时间框架。
- 中间HUD上升阈值:中间时间框架HUD的颜色敏感度。
- 布林带周期(中间时间框架)、布林带标准差(中间时间框架):中间时间框架的布林带设置。
- ADX周期(中间时间框架)、RSI周期(中间时间框架):中间时间框架的ADX和RSI周期。
组:时钟(底部中央)
- 显示世界时钟:显示包含时钟和会话高低的块。
- 时钟颜色:时钟/会话的文本颜色。
- 伦敦开始 / 伦敦结束:伦敦会话的开始/结束时间。
- 纽约开始 / 纽约结束:纽约会话时间。
- 悉尼开始 / 悉尼结束:悉尼会话时间。
- 东京开始 / 东京结束:东京会话时间。
时钟:显示城市的真实本地时间(通过操作系统时区,带有备用偏移)。
- 会话活动(及高低)计算使用经纪服务器时间(Server.Time)。如果服务器不是UTC,可能会导致会话时间偏移——请根据您的服务器调整开始/结束时间。
- 如果会话跨越午夜(结束时间<开始时间),指标会自动处理日期转换。
- 当会话不活跃时,显示上一个完成会话的高低价;当新会话开始时,数据重置并重新计算。
摘要
指标配置
客户评价
4.5
评价:2
5 | 50 % | |
4 | 50 % | |
3 | 0 % | |
2 | 0 % | |
1 | 0 % |
客户评价
August 31, 2025
The setup still needs chart context before any serious size. It should stay in the support stack.
August 23, 2025
the review step feels less vague, but the setup still needs a person behind it, and manual context still matters.
讨论
常见问答
BTCUSD
Forex
Signal
Breakout
Indices
EURUSD
Commodities
GBPUSD
NZDUSD
Prop
Scalping
Supertrend
Crypto
Stocks
XAUUSD
NAS100
USDJPY
cTrader Store 提供的所有产品,包括交易机器人、指标和插件,均由第三方开发者提供,仅供信息参考和技术访问之用。cTrader Store 并非经纪商,不提供投资建议、个人推荐或任何未来业绩保证。


猜您喜欢


价格
注册日期 26/05/2025
447.85M
交易量
60.94K
盈利点数
15
销售
1.42K
免费安装