
Candle Volume Profile Demo
指标
478 下载
版本 1.0, Nov 2025
Windows 版、Mac 版
4.0
评价:1
说明
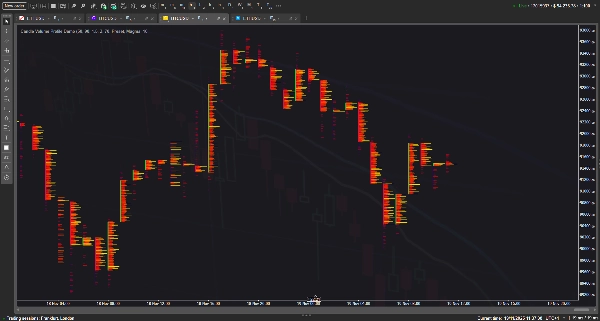
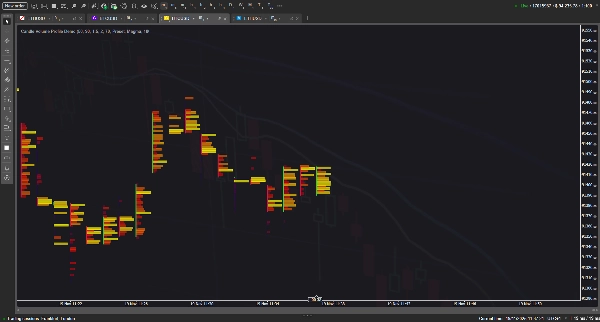
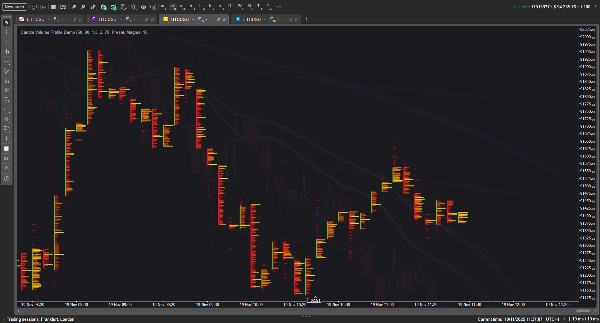
该指标可视化单个柱的成交量分布,将标准的蜡烛图转换为详细的“足迹”风格图表,配备可自定义的热力图、控制点(POC)线和价值区域块,以突出每个价格水平的成交量分布。它旨在通过使用启发式成交量分布,直接在图表上呈现市场活动,模拟专业的订单流工具。
理论上,该概念应能无缝工作,提供深入的市场洞察;然而在实际应用中,由于渲染所需的图形对象数量庞大,您对该指标要求的功能和历史深度越多,它越容易出现延迟并导致终端不稳定。:(
摘要
AI 摘要
Candle Volume Profile Demo is an indicator designed for cryptocurrency markets, specifically visualizing volume distribution within individual candlestick bars. It transforms standard candlesticks into detailed footprint-style charts by applying heuristic volume profiling techniques. Key features include customizable heatmaps, Point of Control (POC) lines, and Value Area blocks, which highlight volume concentration at specific price levels. This approach aims to replicate professional order flow analysis by rendering market activity directly on the price chart, providing granular insights into volume dynamics per bar. The indicator supports BTCUSD and other crypto symbols, integrating concepts such as Fair Value Gap (FVG), ZigZag patterns, ATR, and VWAP for enhanced volume and volatility context. Users can adjust visualization parameters to explore volume profiles over different historical depths, though extensive feature use may impact performance due to graphical complexity. This tool is intended for traders seeking detailed volume-based market structure analysis within crypto trading environments.
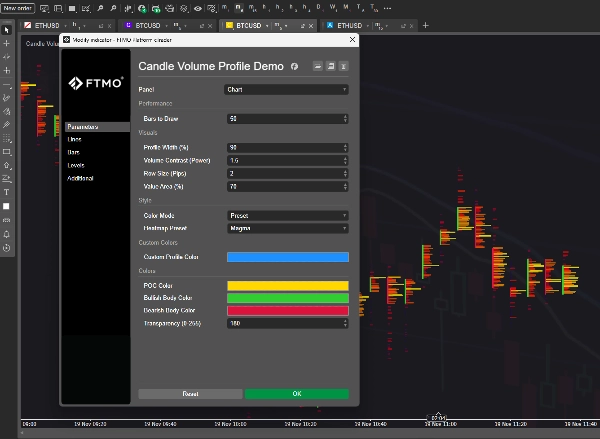
指标配置
客户评价
4.0
评价:1
5 | 0 % | |
4 | 100 % | |
3 | 0 % | |
2 | 0 % | |
1 | 0 % |
客户评价
November 24, 2025
Candle Volume Profile Demo gives you a clean visual of volume distribution inside candles/ranges - a smart add-on for liquidity-aware traders. The visualization is sharp and performance solid, but as a demo version it lacks full features (history logs, advanced filters). Best when paired with structure and confirmation tools. A good starting point, ready to level up.
讨论
常见问答
BTCUSD
Signal
ZigZag
Fair Value Gap
Crypto
ATR
VWAP
cTrader Store 提供的所有产品,包括交易机器人、指标和插件,均由第三方开发者提供,仅供信息参考和技术访问之用。cTrader Store 并非经纪商,不提供投资建议、个人推荐或任何未来业绩保证。


价格
注册日期 26/05/2025
451.48M
交易量
61.16K
盈利点数
15
销售
1.43K
免费安装