
ictkillzonesfromnovem
Indicateur
1 achats
Version 1.0, May 2025
Windows, Mac
Description
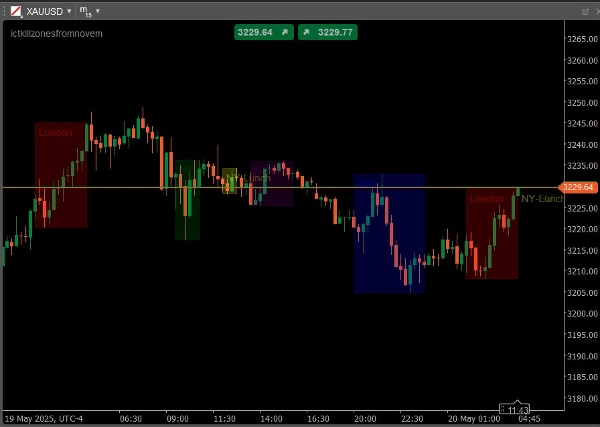
TOUTES LES ZONES DE TUERIE ICT AVEC LES PLUS HAUTS ET LES PLUS BAS DE LA SESSION, LONDRES, ASIE, NY AM, NY DÉJEUNER, NY PM
Résumé
Résumé IA
This indicator displays all ICT (Inner Circle Trader) kill zones along with session highs and lows for major trading sessions: London, Asia, New York AM, New York Lunch, and New York PM. It visually marks these key time zones and price levels on trading charts to assist traders in identifying important market activity periods and potential support or resistance areas based on session highs and lows. The indicator supports multiple global market sessions, providing a consolidated view of critical trading intervals within a single tool.
Profil de l'indicateur
Avis clients
0.0
Avis : 0
Avis clients
Il n'y a pas encore d'avis sur ce produit. Vous l'avez déjà essayé ? Soyez le premier à en parler aux autres !
Discussion
Questions fréquentes
Les produits disponibles sur cTrader Store, notamment les bots de trading, les indicateurs et les plug-ins, sont fournis par des développeurs tiers et mis à disposition à titre informatif et à des fins d'accès technique uniquement. cTrader Store n'est pas un courtier et ne fournit aucun conseil en investissement, aucune recommandation personnelle ni aucune garantie quant aux performances futures.


![Logo de "[Stellar Strategies] Market Session Ultimate"](https://cdn.ctrader.com/image/webp/61ffd537-0125-4246-9e72-42eca1791d64_28232)


Prix
Depuis le 19/05/2025
1
Ventes