
Weekly Daily Levels
Indicateur
2 achats
Version 1.0, Aug 2025
Windows, Mac
5.0
Avis : 2
Description
Vous appuyez-vous sur les prix OHLC quotidiens et hebdomadaires ainsi que sur les points médians dans votre stratégie de trading ? Marre de les marquer manuellement à chaque fois que vous effectuez une transaction ?
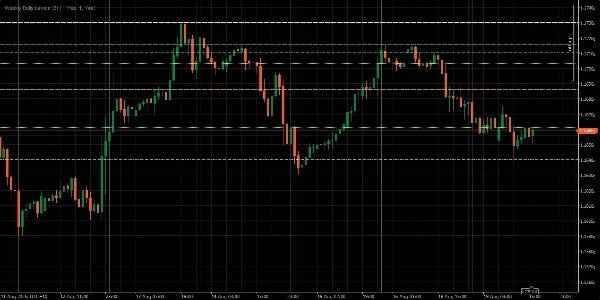
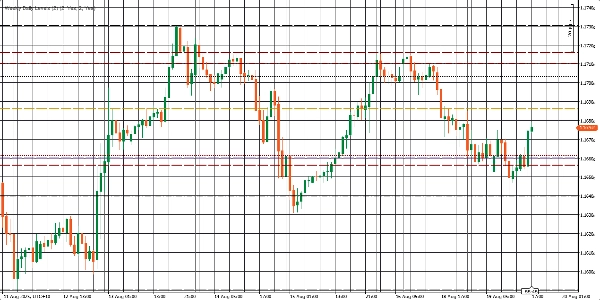
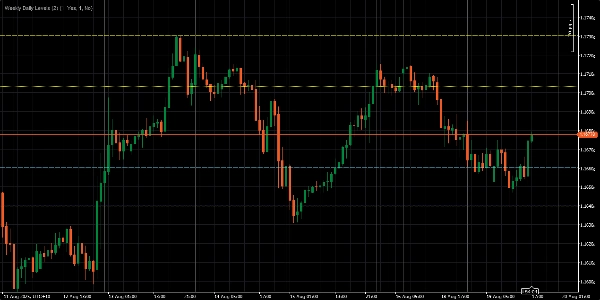
Le Weekly Daily Levels Indicator fait le travail lourd pour vous. Il trace automatiquement les prix d'ouverture, haut, bas, clôture (OHLC) et les points médians du jour précédent et de la semaine précédente directement sur votre graphique. Cela signifie que vous pouvez vous concentrer sur l'exécution de votre stratégie pendant que l'indicateur s'occupe des détails—rendant votre trading plus simple, plus rapide et bien plus efficace.
Caractéristiques clés :
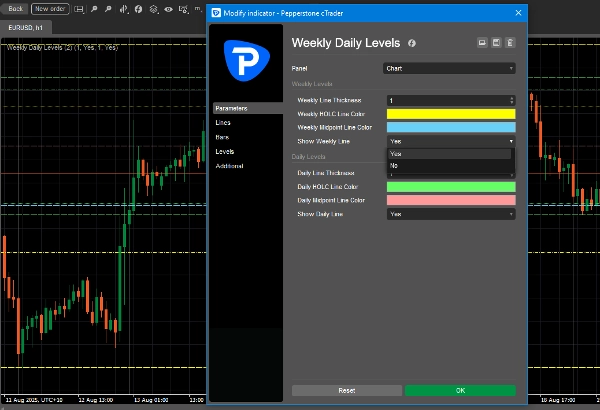
- Affiche instantanément les prix OHLC quotidiens et hebdomadaires ainsi que les points médians.
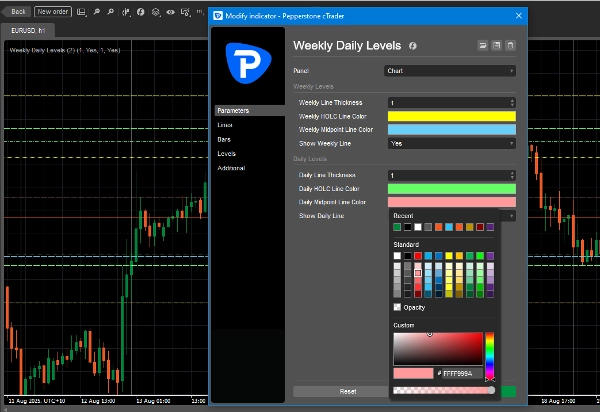
- Personnalisez les couleurs des lignes pour correspondre au style de votre graphique.
- Activez ou désactivez les niveaux quotidiens ou hebdomadaires en un seul clic.
- Ajustez l'épaisseur des lignes pour une meilleure visibilité.
Résumé
Résumé IA
The Weekly Daily Levels indicator automatically plots the previous day’s and previous week’s open, high, low, close (OHLC) prices along with their mid-points directly on trading charts. It provides instant visual reference to these key price levels, helping traders incorporate daily and weekly price data into their strategies without manual marking. Users can customize line colors and thickness to fit their chart style and toggle daily or weekly levels on or off with a single click. This indicator streamlines the process of tracking important historical price levels for improved trading efficiency.
Profil de l'indicateur
Avis clients
5.0
Avis : 2
5 | 100 % | |
4 | 0 % | |
3 | 0 % | |
2 | 0 % | |
1 | 0 % |
Avis clients
August 28, 2025
Not bad if the rules are already clear. Two timeframes give more context.
August 21, 2025
the good surprise is the setup needs less second guessing, and It works better with a written plan.
Discussion
Questions fréquentes
Les produits disponibles sur cTrader Store, notamment les bots de trading, les indicateurs et les plug-ins, sont fournis par des développeurs tiers et mis à disposition à titre informatif et à des fins d'accès technique uniquement. cTrader Store n'est pas un courtier et ne fournit aucun conseil en investissement, aucune recommandation personnelle ni aucune garantie quant aux performances futures.


Prix
Depuis le 19/04/2025
2
Ventes