
Description
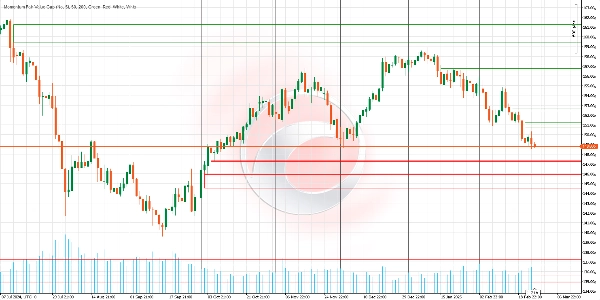
Il identifie les zones de déséquilibre du marché (Fair Value Gaps ou FVG) et les projette sur le graphique de manière intelligente. Contrairement à d'autres indicateurs, celui-ci s'adapte en temps réel à l'action des prix, ajustant sa taille, sa persistance et sa pertinence. Il est idéal pour les traders recherchant des objectifs clairs et une gestion avancée des gaps visuels.
✨ CARACTÉRISTIQUES CLÉS
- Ajustement Dynamique des Gaps
Logique : Si le prix touche partiellement un FVG (par exemple, effleure la limite inférieure), l'indicateur redimensionne automatiquement le gap pour ne refléter que la zone non couverte.
Avantage : Évite les faux signaux et ne garde actifs que les gaps avec un réel potentiel. - Remplissage au Point Médian
Logique : Trace une ligne au centre du gap. Si le prix la touche, le FVG est considéré comme "rempli" et peut être supprimé (configurable).
Avantage : Nécessite seulement 50 % de contact pour confirmer la fermeture, filtrant le bruit et les trades prématurés. - Projection Infinie Jusqu'au Remplissage
Logique : Les gaps s'étendent indéfiniment dans le futur (ils ne disparaissent pas après X chandeliers).
Avantage : Fournit une référence persistante jusqu'à ce que le marché résolve le déséquilibre. - Nettoyage Automatique des Gaps Invalidés
Logique : Supprime automatiquement les anciens gaps lorsqu'ils sont entièrement remplis.
Avantage : Garde le graphique propre et concentré sur les zones actives. - Personnalisation Visuelle Avancée
Options : Différentes couleurs pour les gaps haussiers (vert) et baissiers (rouge). Ajustement de la transparence pour éviter l'encombrement du graphique.
Avantage : S'adapte à tout style de trading ou stratégie visuelle.
🎯 COMMENT L'UTILISER EN TRADING ?
Identification des Zones Clés :
- FVG haussier (vert) : Zone où les acheteurs ont temporairement perdu de la force.
→ Stratégie : Chercher des opportunités d'achat lors des replis vers cette zone. - FVG baissier (rouge) : Zone où les vendeurs ont été dépassés.
→ Stratégie : Chercher des opportunités de vente lors des rallyes vers cette zone.
Interaction avec le Prix :
- Si le gap s'ajuste dynamiquement (réduit sa taille), cela indique que le marché teste la zone mais sans confirmation.
- Si le gap est supprimé (par remplissage complet ou MidPoint), considérez le déséquilibre corrigé.
🔍 CONFIRMATION AVEC D'AUTRES OUTILS
Combinez les FVG avec les supports/résistances, le volume ou le RSI pour filtrer les signaux.
📋 COMPARAISON DES FONCTIONNALITÉS
___________________________________________________________________________________
Fonctionnalité Momentum Fair Value Gap Traditional Indicators
________________________________________________________________________________
Persistance---------------- Prolonge les gaps jusqu'à remplissage ----------------------- Disparaît après X chandeliers
Précision de fermeture-------- Option de confirmation à 50% --------------------- Nécessite un remplissage complet du gap
Flexibilité ------------------ Redimensionne avec le prix ------------------------- Niveaux statiques et immuables
Focus Visuel---------------- Supprime les gaps non pertinents ----------------------- Encombre le graphique avec des données passées
📝 EXEMPLE PRATIQUE
Scénario sur EURUSD (1H) :
Un FVG haussier (vert) se forme après une bougie baissière prononcée. Quelques jours plus tard, le prix recule, touchant la limite inférieure du gap sans le remplir. L'indicateur réduit automatiquement la taille du gap. Enfin, le prix touche le MidPoint (ligne centrale), déclenchant sa suppression. Le trader prend une position courte après avoir confirmé un rejet dans la zone.
Indicateurs du Ctrader Store :
Dynamic Market Structure
Analysis of Turning Points
Fibonacci Linear
Regression Multi-timeframe
Multi-Level Candle Bias
Tracker
Auto Support and
Resistance Trend Lines
Résumé
Key features include:
- Dynamic Gap Adjustment: Automatically resizes gaps when price partially touches them, reducing false signals.
- MidPoint Fill: Marks the gap centerline; if price touches it, the gap is considered filled and can be removed, requiring only 50% contact for confirmation.
- Infinite Projection: Gaps extend indefinitely until filled, maintaining persistent market imbalance references.
- Automatic Cleanup: Removes fully filled gaps to keep charts focused on active zones.
- Advanced Visual Customization: Uses distinct colors for bullish (green) and bearish (red) gaps with adjustable transparency.
In trading, bullish FVGs indicate zones where buyers lost strength, suggesting buying opportunities on pullbacks; bearish FVGs mark where sellers were overtaken, indicating selling opportunities on rallies. The indicator’s dynamic interaction with price helps confirm market imbalance resolution.
It is recommended to combine this indicator with other tools like support/resistance levels, volume, or RSI for signal filtering.
Avis clients
5 | 0 % | |
4 | 100 % | |
3 | 0 % | |
2 | 0 % | |
1 | 0 % |


