
Deskripsi
Apa itu indikator “Initial Range”?
Indikator ini adalah port dari alat Pine Script “Opening Range Breakout”.
Awalnya disebut ORB – Opening Range Breakout: Anda mengambil rentang harga dari menit-menit pertama sesi, lalu memperdagangkan breakout dari rentang tersebut.
Dalam versi ini kami menggantinya menjadi IR – Initial Range, tapi idenya sama:
- Indikator membangun beberapa Initial Ranges:
-
- IR5 – 5 menit pertama
- IR15 – 15 menit pertama
- IR30 – 30 menit pertama
- IR60 – 60 menit pertama
- Untuk setiap IR Anda memiliki:
-
- IR High
- IR Low
- IR Mid (titik tengah rentang)
- Anda dapat memilih rentang mana yang aktif dan warna apa yang mereka gunakan.
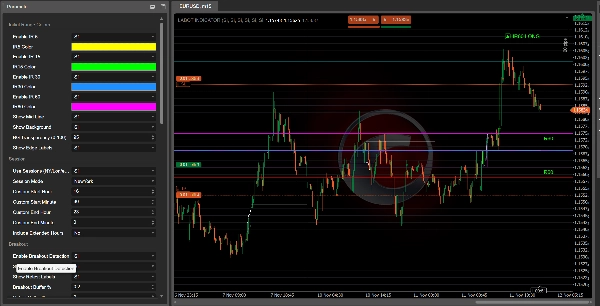
Setelah rentang selesai, indikator mencari harga yang menembus keluar dari rentang tersebut:
- Break di atas IR High → IR60 LONG, IR30 LONG, dll.
- Break di bawah IR Low → IR60 SHORT, IR30 SHORT, dll.
Label ini muncul di grafik sehingga Anda dapat dengan cepat melihat rentang awal mana yang menghasilkan sinyal.
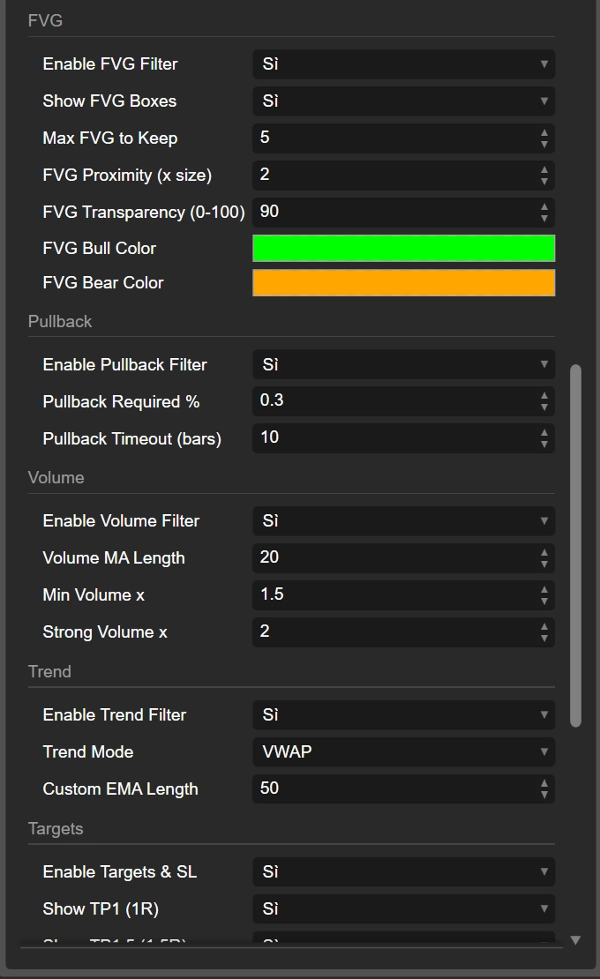
Filter dan konfirmasi
Indikator dirancang untuk menghindari breakout acak dengan menggabungkan beberapa filter:
- Filter tren
Anda dapat menggunakan: -
- VWAP
- EMA
- Panjang EMA kustom
- VWAP + EMA bersama-sama
Breakout dalam arah tren lebih diutamakan (misalnya, LONG hanya saat harga di atas VWAP/EMA).
- Filter volume
Indikator membandingkan volume saat ini dengan rata-rata bergerak volume: -
- konfirmasi “normal”
- volume “kuat”
Breakout dengan volume lemah dapat diabaikan jika Anda mau.
- Filter FVG (Fair Value Gap)
Ini mendeteksi FVG bullish dan bearish dan dapat mengharuskan breakout terjadi di dekat FVG yang relevan: -
- FVG bullish dekat IR High mendukung LONG
- FVG bearish dekat IR Low mendukung SHORT
- Filter pullback
Anda dapat mengharuskan pullback minimum setelah breakout dan jendela waktu (dalam bar) untuk pullback tersebut terjadi. Ini membantu Anda fokus pada breakout yang benar-benar “bernapas” sebelum melanjutkan.
Breakout, retest, dan gagal break
Setelah breakout dari Initial Range, indikator melacak apa yang dilakukan harga selanjutnya:
- Menghitung berapa banyak bar yang tetap di luar rentang.
- Memeriksa apakah harga bergerak cukup jauh (jarak minimum dalam %).
- Kemudian mengamati retest kembali ke dalam rentang.
Anda dapat melihat:
- IR60 LONG / IR60 SHORT (breakout)
- Retest LONG / Retest SHORT label saat harga kembali setelah pergerakan yang solid
- Failed LONG / Failed SHORT label saat breakout gagal dengan cepat dan harga masuk kembali ke rentang tanpa komitmen.
Ini memberi Anda tiga jenis informasi:
- breakout bersih
- breakout sehat dengan retest
- breakout palsu/gagal
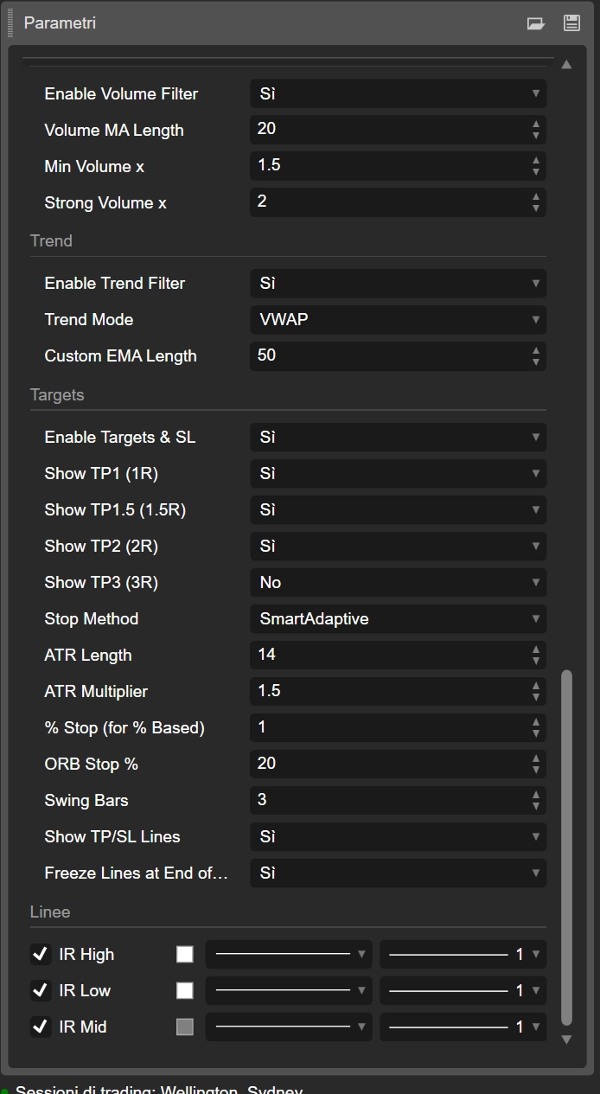
Target, stop loss dan visualisasi perdagangan
Indikator juga menghitung level TP dan SL otomatis berdasarkan:
- ATR
- % dari lebar IR
- stop % tetap
- titik ayunan
- mode ATR “cerdas” adaptif dan skala
Dari harga masuk dan level stop, indikator menghitung beberapa target:
- TP1 (1R)
- TP1.5 (1.5R)
- TP2 (2R)
- TP3 (3R)
Anda dapat memilih target mana yang akan ditampilkan.
Garis digambar di grafik:
- IR_ENTRY_LONG / IR_ENTRY_SHORT
- IR_SL_LONG / IR_SL_SHORT
- IR_TP1 / IR_TP1.5 / IR_TP2 / IR_TP3
Ketika harga mencapai target atau stop, status diperbarui dan garis dapat “dibekukan” baik setelah TP terakhir atau pada akhir hari, tergantung pengaturan Anda.
Singkatnya
- Nama lama: ORB (Opening Range Breakout)
- Nama baru: IR (Initial Range) – konsep sama, nama lebih bersih
- Membangun rentang sesi awal (IR5, IR15, IR30, IR60)
- Menandai breakout LONG / SHORT, retest, dan gagal break
- Menggunakan filter tren, volume, FVG, dan pullback untuk meningkatkan kualitas
- Menggambar entry, stop dan beberapa target langsung di grafik
Jadi ketika Anda melihat “IR60 LONG” di grafik, Anda pada dasarnya sedang melihat Opening Range Breakout pada 60 menit pertama sesi – hanya dengan nama yang lebih modern, dapat disesuaikan, dan banyak logika tambahan di belakangnya.
Ringkasan
The indicator marks breakout signals when price moves above the range high (LONG) or below the range low (SHORT), displaying corresponding labels on the chart. It also tracks retests and failed breakouts, distinguishing clean breakouts, healthy retests, and fake moves.
To improve signal quality, the indicator incorporates multiple filters: trend filters using VWAP and EMA, volume filters comparing current volume to averages, Fair Value Gap (FVG) filters detecting bullish or bearish imbalances near breakout levels, and pullback filters requiring minimum retracements after breakouts.
Additionally, it calculates and plots automatic entry, stop loss, and multiple take profit levels based on ATR, percentage of the initial range width, fixed percentages, swing points, and adaptive ATR modes. These visual aids help traders manage risk and targets directly on the chart.
The Initial Range indicator supports various markets including Forex, stocks, indices, commodities, and cryptocurrencies, and is designed to enhance breakout trading strategies with customizable parameters and comprehensive trade visualization.
Ulasan pelanggan
5 | 100 % | |
4 | 0 % | |
3 | 0 % | |
2 | 0 % | |
1 | 0 % |


