
FVG & Imbalance Detector
Indikator
2 pembelian
Versi 1.0, Jan 2026
Windows, Mac
4.0
Ulasan: 2
Deskripsi
Dalam dunia Smart Money Concepts (SMC) dan ICT, ketidakseimbangan harga adalah "sidik jari" dari pemain institusional besar. Ketika pasar bergerak terlalu cepat, ia meninggalkan Fair Value Gap (FVG)—zona ketidakefisienan yang hampir selalu dikembalikan oleh harga untuk "mengisi" atau menguji ulang.
Detektor FVG & Imbalance untuk cTrader adalah alat berkinerja tinggi yang dirancang untuk secara otomatis mendeteksi ketidakefisienan ini. Tidak perlu lagi menggambar manual—dapatkan zona yang jelas dan dapat ditindaklanjuti langsung di grafik Anda.
Mengapa indikator ini wajib dimiliki:
- 🚀 Deteksi Pergerakan Institusional: Lihat di mana bank besar dan hedge fund telah memasuki pasar dengan volume besar.
- 🎯 Zona Probabilitas Tinggi: Gunakan ketidakseimbangan yang teridentifikasi sebagai target magnetik untuk take-profit atau sebagai "Zona Emas" untuk entri presisi.
- 📈 Visualisasi Bersih: Overlay persegi panjang berkualitas tinggi yang membuat analisis tren menjadi mudah.
- 🔧 Sangat Fleksibel: Berbeda dengan indikator dasar, versi ini memungkinkan Anda memperpanjang zona ke masa depan atau menyesuaikan titik awalnya agar sesuai dengan strategi spesifik Anda.
Fitur Eksklusif:
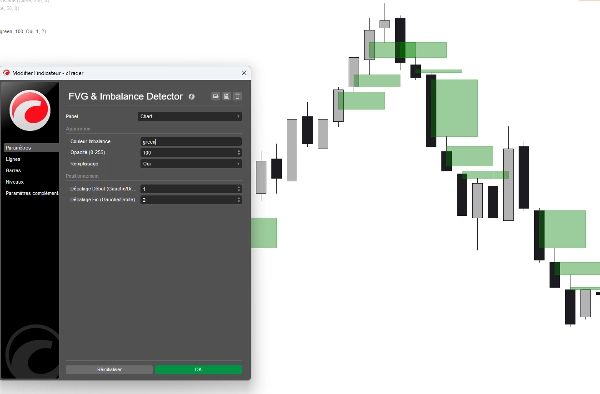
- Logika Deteksi Cerdas: Algoritma canggih mengidentifikasi ketidakefisienan Top (Bearish) dan Bottom (Bullish) dengan akurasi pixel-perfect.
- Offset Dua Arah: Parameter offset "Start" dan "End" eksklusif memungkinkan Anda memproyeksikan zona ke depan atau ke belakang untuk melihat bagaimana gap historis selaras dengan aksi harga saat ini.
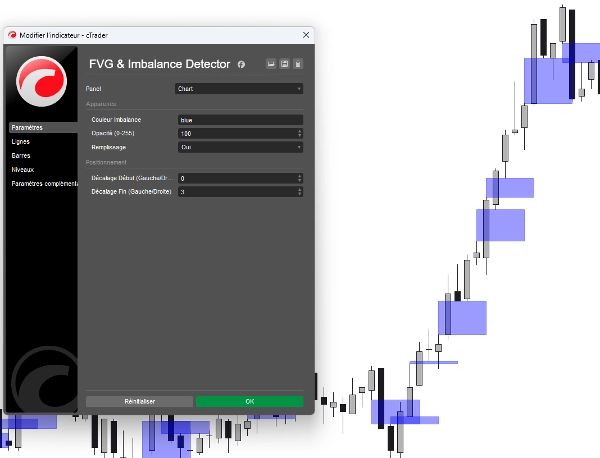
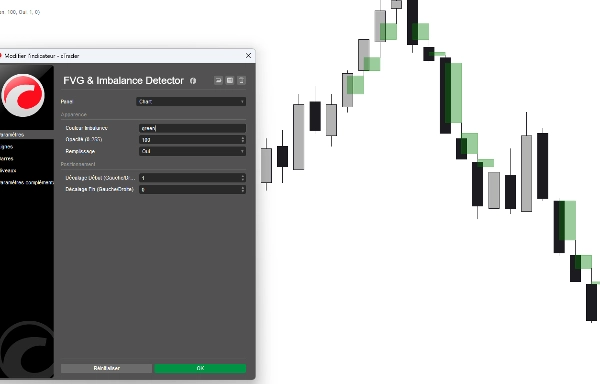
- UI Warna Profesional: Pilih gaya favorit Anda melalui menu dropdown yang bersih (Kuning, Aqua, Merah, dll.)—tidak perlu lagi mengetik kode hex!
- Kontrol Opasitas: Sesuaikan transparansi agar zona tidak mengacaukan pandangan Anda terhadap aksi harga.
- Performa Optimal: Kode ringan yang tidak akan memperlambat platform cTrader Anda, bahkan pada banyak grafik.
Cara menggunakannya:
- Identifikasi Gap: Indikator menggambar kotak di mana terjadi ketidakseimbangan antara harga tertinggi lilin pertama dan harga terendah lilin ketiga.
- Tunggu Retest: Perhatikan harga kembali ke kotak-kotak ini.
- Eksekusi: Cari pola penolakan di dalam zona FVG untuk entri berisiko rendah dan imbal hasil tinggi.
Ringkasan
Ringkasan AI
The FVG & Imbalance Detector is an indicator for the cTrader platform designed to identify Fair Value Gaps (FVG) and price imbalances, key concepts in Smart Money Concepts (SMC) and Institutional Cycle Trading (ICT). These gaps represent zones of market inefficiency created by rapid price moves, often reflecting institutional activity. The indicator automatically detects and highlights these zones on the chart with clear rectangular overlays, eliminating the need for manual drawing.
Key features include detection of both bullish (bottom) and bearish (top) imbalances with high precision, customizable zone extensions via start and end offset parameters, and adjustable opacity and color settings for clear visualization. The tool is optimized for performance to avoid slowing down the platform, even when applied to multiple charts.
Traders can use the indicator to spot where large institutional players have entered the market, identify high-probability zones for entries or take-profits, and monitor price retests of these inefficiency zones for potential trade execution. The indicator supports analysis across various markets including Forex, Indices, Commodities, and Crypto.
Profil indikator
Ulasan pelanggan
4.0
Ulasan: 2
5 | 0 % | |
4 | 100 % | |
3 | 0 % | |
2 | 0 % | |
1 | 0 % |
Ulasan pelanggan
January 18, 2026
tested small first and that felt like the right move, and account protection still comes first.
January 14, 2026
Diskusi
Pertanyaan umum
Forex
Indices
Commodities
Crypto
AI
Produk-produk yang tersedia melalui cTrader Store, termasuk bot trading, indikator, dan plugin, disediakan oleh pengembang pihak ketiga serta hanya ditujukan untuk akses teknis dan informasi. cTrader Store bukan broker dan tidak menyediakan saran investasi, rekomendasi pribadi, atau jaminan apa pun tentang kinerja di masa mendatang.
Produk lain dari penulis ini


Harga
Sejak 27/10/2025
10
Penjualan