
Deskripsi
Konsep "Reverse Engineering"
Inovasi utama dari indikator ini terletak pada algoritma Reverse Engineering. Biasanya, osilator stokastik mengambil data harga dan mengubahnya menjadi angka antara 0 dan 100. Indikator ini melakukan kebalikan: ia mengambil level matematis dari osilator dan memproyeksikannya kembali ke skala harga.
Ini memungkinkan trader untuk menerjemahkan momentum matematis menjadi level harga konkret ($ atau pips) langsung pada grafik.
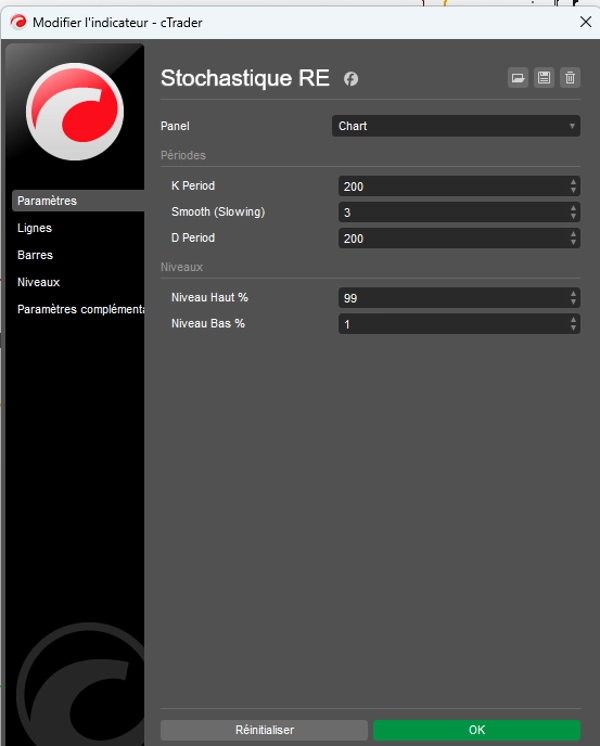
Menentukan Batas: Langit-langit (99%) dan Lantai (1%)
Berbeda dengan pengaturan klasik (80/20), indikator ini secara default diatur ke 1% dan 99%. Konfigurasi ini memiliki tujuan khusus: ia menentukan batas fisik harga.
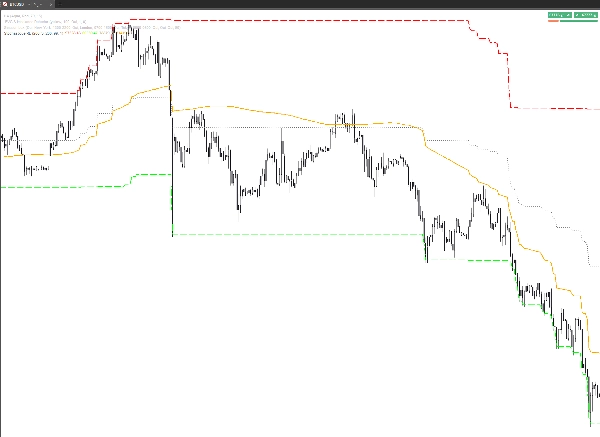
- Level 99% (Langit-langit Harga): Ia menentukan harga tertinggi yang dapat dicapai pasar sebelum dianggap telah menghabiskan 99% dari amplitudo pergerakannya selama periode tertentu. Ini adalah "batas" harga.
- Level 1% (Lantai Harga): Ia menentukan harga terendah, dukungan utama dari siklus saat ini. Ini adalah level di mana harga telah menghabiskan 99% dari kapasitas penurunannya relatif terhadap sejarah terbarunya.
Mengapa Ini "Menentukan Harga"?
Berkat sistem ini, garis Orange Signal %D tidak lagi hanya sebuah kurva yang bergerak dalam kekosongan.
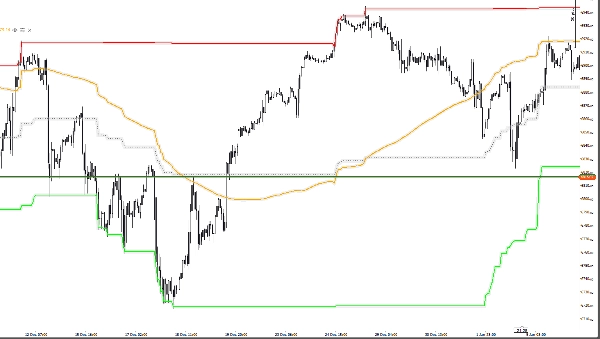
- Lokalisasi Harga: Ia menunjukkan lokasi tepat dari "harga wajar" yang diberi bobot oleh momentumnya.
- Pemetaan Rentang: Ia mengubah grafik menjadi peta di mana Anda dapat melihat apakah harga saat ini "bernilai" 1% atau 99% dari potensinya.
- Target Konkret: Jika garis oranye bergerak naik, itu bukan hanya berusaha mencapai "80"; ia berusaha mencapai harga tepat yang ditampilkan oleh garis merah (99%).
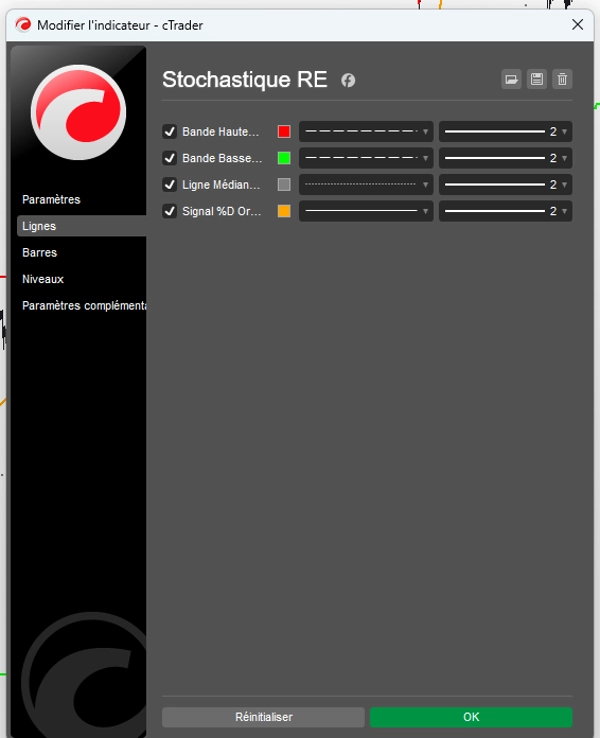
Fungsi Garis (Tab Garis)
Semua dapat disesuaikan untuk pembacaan visual instan:
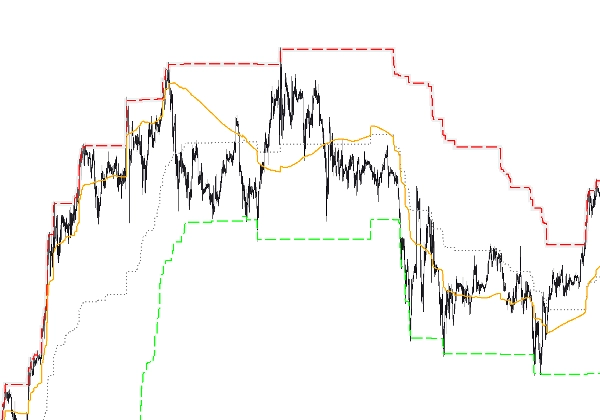
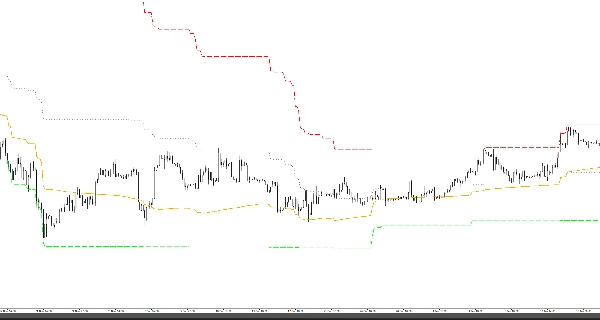
- Pita Atas (99%): Langit-langit harga teoritis.
- Pita Bawah (1%): Lantai harga teoritis.
- Garis Tengah (50%): Titik pivot tengah, zona keseimbangan.
- Orange Signal %D: Kursor dinamis yang bergerak antara lantai dan langit-langit untuk menentukan arah pasar.
Ringkasan Trader
Indikator ini tidak hanya memberi tahu Anda bahwa pasar "jenuh beli"; ia menunjukkan pada harga tepat berapa pasar menjadi secara fisik terlalu mahal (99%) atau terlalu murah (1%). Ini adalah alat presisi yang mengembalikan matematika ke realitas buku order.
Ringkasan
The indicator displays these boundaries directly on the price chart, allowing traders to see exact price levels where the market is considered overbought or oversold. Key features include customizable lines for the upper band (99%), lower band (1%), mid line (50%), and an orange signal %D line that dynamically indicates market direction between these boundaries.
By translating momentum into precise price targets, Stochastique RE helps traders localize fair price zones, map price ranges, and identify concrete price targets rather than abstract oscillator values. It supports various markets including Forex, stocks, commodities, indices, and cryptocurrencies, with symbol tags such as BTCUSD, EURUSD, GBPUSD, XAUUSD, NAS100, and USDJPY.
Ulasan pelanggan
5 | 67 % | |
4 | 33 % | |
3 | 0 % | |
2 | 0 % | |
1 | 0 % |


