
HA
Indikator
2 pembelian
Versi 1.0, Jan 2026
Windows, Mac
4.0
Ulasan: 1
Deskripsi
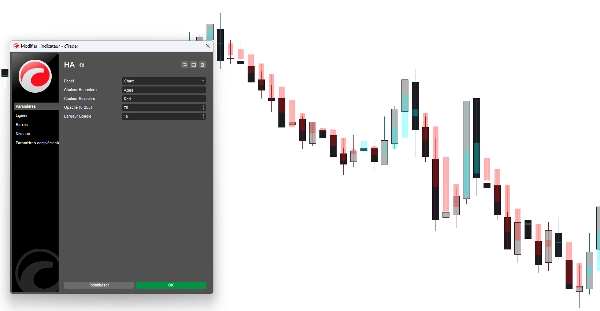
The Pro Heikin Ashi Visual Overlay adalah alat yang sempurna untuk para trader yang menginginkan manfaat pelurusan tren dari lilin Heikin Ashi sambil tetap menjaga grafik candlestick atau bar standar mereka aktif.
Grafik Heikin Ashi tradisional mengharuskan Anda untuk mengganti seluruh jenis grafik, sehingga sulit untuk melihat aksi harga yang tepat. Indikator ini menyelesaikan masalah itu dengan menggambar lilin Heikin Ashi sebagai lapisan semi-transparan, memungkinkan Anda untuk langsung melihat pembalikan tren dan momentum pasar tanpa kehilangan pandangan terhadap harga sebenarnya.
Mengapa menggunakan Overlay ini?
- 💎 Pengurangan Kebisingan: Heikin Ashi menyaring kebisingan pasar, membuatnya lebih mudah untuk tetap dalam perdagangan yang menang.
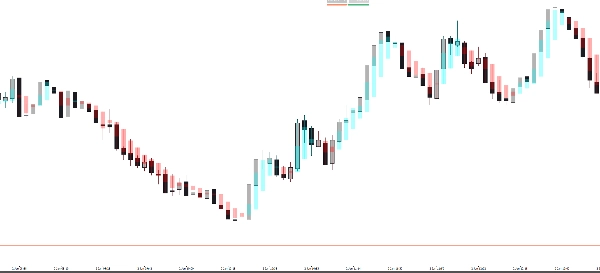
- 🕯️ Tampilan Dual-Grafik: Pertahankan lilin standar Anda untuk aksi harga/pola sambil menggunakan overlay HA untuk arah tren.
- 🎨 Sepenuhnya Dapat Disesuaikan: Sesuaikan opasitas dan warna agar sesuai dengan ruang kerja Anda (mode Gelap atau Terang).
- 🚀 Identifikasi Tren Instan: Zona Biru (Bullish) dan Merah (Bearish) membantu Anda menghindari trading melawan momentum.
Fitur Utama:
- Transparansi Cerdas: Atur opasitas agar overlay tidak menutupi aksi harga utama Anda.
- Penyesuaian Sempurna: Dihitung secara real-time untuk menyesuaikan nilai Heikin Ashi pada timeframe saat ini.
- Desain Profesional: Visual yang bersih yang tidak membuat grafik Anda berantakan.
- Universal: Bekerja pada semua timeframe (M1 hingga Bulanan) dan semua aset (Forex, Saham, Kripto, Indeks).
Cara menggunakannya:
- Terapkan indikator ke grafik Anda.
- Sesuaikan Opasitas dan Lebar Badan di pengaturan sesuai preferensi Anda.
- Gunakan lilin HA untuk mengonfirmasi kekuatan tren:
-
- Sumbu panjang ke arah tren = Momentum Kuat.
- Badan kecil dengan sumbu di kedua sisi = Potensi Pembalikan.
Parameter:
- Warna Bullish: Warna khusus untuk lilin HA naik.
- Warna Bearish: Warna khusus untuk lilin HA turun.
- Opasitas (0-255): Kontrol seberapa "hantu" atau padat tampilan lilin.
- Lebar Lilin: Sesuaikan ketebalan lilin HA agar sesuai sempurna dengan tingkat zoom Anda.
Ringkasan
Ringkasan AI
The Pro Heikin Ashi Visual Overlay is an indicator designed to enhance trend analysis by overlaying Heikin Ashi candles on standard candlestick or bar charts. Unlike traditional Heikin Ashi charts that replace the entire chart type, this tool provides a semi-transparent overlay, allowing traders to observe smoothed trend signals while retaining visibility of actual price action.
Key features include noise reduction to filter market fluctuations, customizable opacity and colors for integration with different chart backgrounds, and real-time alignment with the current timeframe’s Heikin Ashi calculations. The overlay uses blue and red zones to indicate bullish and bearish trends, aiding in immediate trend identification. It supports all timeframes from one minute to monthly and is compatible with various asset classes including Forex, stocks, cryptocurrencies, commodities, and indices.
Users can adjust candle width and opacity to suit their chart zoom level and visual preferences. The indicator facilitates dual-chart viewing, enabling simultaneous analysis of precise price patterns and smoothed trend momentum. It is designed with clean visuals to avoid chart clutter and supports professional trading environments.
Profil indikator
Ulasan pelanggan
4.0
Ulasan: 1
5 | 0 % | |
4 | 100 % | |
3 | 0 % | |
2 | 0 % | |
1 | 0 % |
Diskusi
Pertanyaan umum
Forex
Signal
Indices
Commodities
Crypto
Stocks
Produk-produk yang tersedia melalui cTrader Store, termasuk bot trading, indikator, dan plugin, disediakan oleh pengembang pihak ketiga serta hanya ditujukan untuk akses teknis dan informasi. cTrader Store bukan broker dan tidak menyediakan saran investasi, rekomendasi pribadi, atau jaminan apa pun tentang kinerja di masa mendatang.
Produk lain dari penulis ini


![Logo "Gaussian Channel [Iridio Capital]"](https://cdn.ctrader.com/image/webp/7c039209-5573-4a54-a072-f9528b503103_41960)


Harga
Sejak 27/10/2025
10
Penjualan