

Mô tả
Chỉ báo MACD Nâng cao với Thay đổi Màu sắc Động và Khối lượng
Mô tả: Chỉ báo MACD Nâng cao của chúng tôi không chỉ là một biểu đồ cột đơn giản. Chỉ báo này được thiết kế để cung cấp cái nhìn rõ ràng và động về xu hướng thị trường, với các tính năng độc đáo làm cho nó trở nên không thể thiếu đối với bất kỳ nhà giao dịch nghiêm túc nào.
Các Tính năng Chính:
- Thay đổi Màu sắc Động:
-
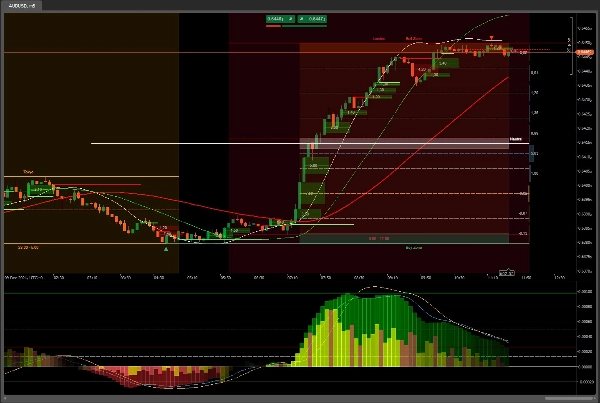
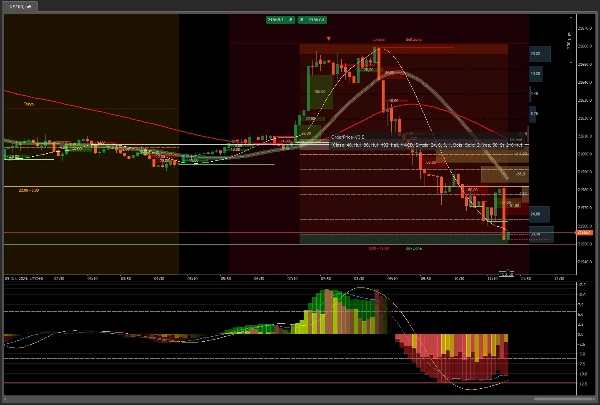
- Tích cực: Biểu đồ cột thay đổi từ màu xanh lá sang trắng khi giá trị tăng lên, cung cấp hình ảnh rõ ràng về xu hướng tăng giá.
- Tiêu cực: Biểu đồ cột thay đổi từ màu đỏ sang trắng khi giá trị giảm xuống, làm nổi bật xu hướng giảm giá.
- Chỉ báo Khối lượng:
-
- Khối lượng Tích cực: Được biểu thị bằng các thanh màu xanh lá, cho thấy sự tăng khối lượng giao dịch.
- Khối lượng Tiêu cực: Được biểu thị bằng các thanh màu đỏ, cho thấy sự giảm khối lượng giao dịch.
- Hình ảnh Rõ ràng: Sự kết hợp màu sắc trong các thanh khối lượng (xanh lá, vàng, nâu, đỏ) cung cấp cái nhìn rõ ràng về hoạt động mua bán trên thị trường.
- Tự động Phóng to:
-
- Giữ cho chỉ báo luôn ở giữa và tự động điều chỉnh để có góc nhìn tối ưu, không cần phải điều chỉnh thủ công liên tục.
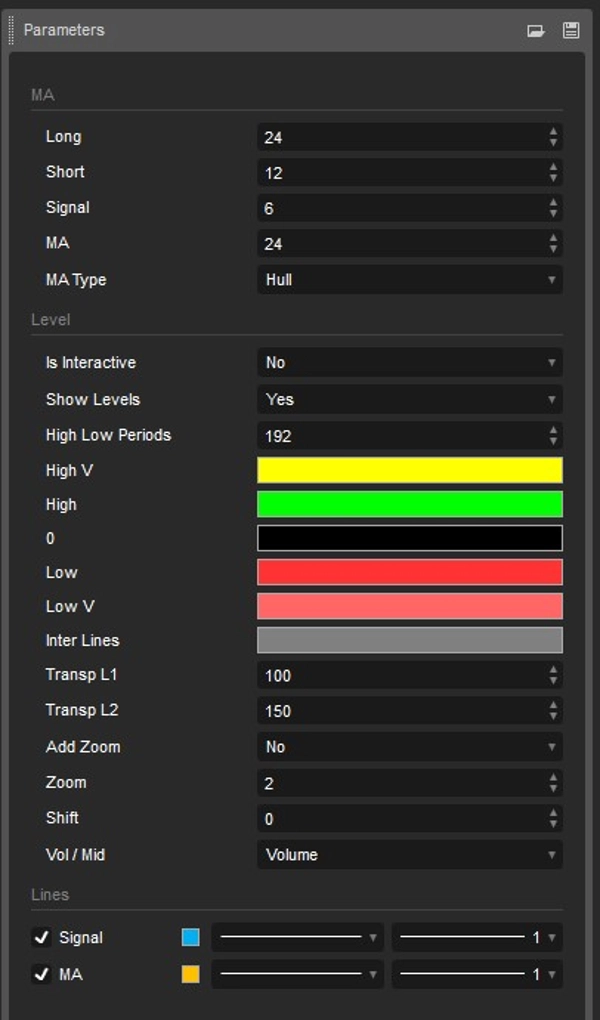
- Trung bình Động Tùy chỉnh:
-
- Bao gồm một đường trung bình động bổ sung mà bạn có thể chọn từ các tùy chọn có sẵn, cho phép tùy chỉnh và thích ứng tốt hơn với chiến lược giao dịch của bạn.
- Đỉnh và Đáy:
-
- Hiển thị mức cao nhất và thấp nhất trong khoảng thời gian đã chọn, cung cấp cái nhìn rõ ràng về các cực điểm của thị trường.
Lợi ích:
- Độ Rõ Ràng Hình ảnh: Thay đổi màu sắc động giúp dễ dàng nhận biết các xu hướng và điểm chuyển đổi trên thị trường.
- Tùy chỉnh: Khả năng chọn các đường trung bình động khác nhau và điều chỉnh mức màu sắc cho phép bạn tùy chỉnh chỉ báo theo nhu cầu cụ thể của mình.
- Hiệu quả: Tự động phóng to đảm bảo bạn luôn có góc nhìn tốt nhất về chỉ báo mà không cần điều chỉnh thủ công.
- Phân tích Toàn diện: Bao gồm khối lượng và các mức cao/thấp cung cấp cái nhìn đầy đủ hơn về thị trường.
Phù hợp cho:
- Các nhà giao dịch tìm kiếm một công cụ nâng cao và có thể tùy chỉnh để nâng cao phân tích kỹ thuật của họ.
- Những người muốn có hình ảnh rõ ràng và động về xu hướng thị trường.
- Người dùng đánh giá cao hiệu quả và khả năng tùy chỉnh trong các công cụ giao dịch của họ.
Với các công cụ bổ sung như
OrderPrice V3 https://ctrader.com/products/397
NTMPICLL https://ctrader.com/products/327
Range Box Level https://ctrader.com/products/245
Or RangeBoxFibonacci https://ctrader.com/products/526
Market Session https://ctrader.com/products/525
MacdVolume https://ctrader.com/products/267
4MA https://ctrader.com/products/247
Bạn sẽ trở nên bất khả chiến bại
Chúc bạn may mắn 😀
Tóm tắt
Key functionalities include auto zoom, which keeps the indicator centered and optimally scaled without manual adjustment, and a customizable moving average that can be selected from available options to fit different trading strategies. The indicator also displays the highest and lowest price levels within the selected period, providing insight into market extremes.
Designed for traders seeking a customizable and efficient tool, MACDVolume offers clear visual cues for trend identification and comprehensive market analysis by integrating volume and price extremes. It supports markets such as Forex and Stocks and is suitable for users who prioritize clarity, customization, and efficiency in their technical indicators.
Đánh giá của khách hàng
5 | 100 % | |
4 | 0 % | |
3 | 0 % | |
2 | 0 % | |
1 | 0 % |


