
Zero Lag LSMA
Chỉ báo
6 lượt mua
Phiên bản 1.0, Aug 2025
Windows, Mac
4.6
Đánh giá: 3
Mô tả
Chỉ báo Zero Lag LSMA (Trung bình động bình phương tối thiểu không trễ) là một chỉ báo kỹ thuật tiên tiến được thiết kế cho các nhà giao dịch tìm kiếm sự phản hồi nhanh hơn và độ chính xác cao hơn trong phân tích xu hướng. Khác với các trung bình động truyền thống thường bị trễ so với biến động giá, nó giảm thiểu độ trễ bằng cách áp dụng quy trình hồi quy tuyến tính kép, làm cho nó lý tưởng để xác định hướng xu hướng và các điểm đảo chiều tiềm năng trong thời gian thực. Chỉ báo này rất phù hợp cho forex, cổ phiếu, hàng hóa và các thị trường khác.
Các tính năng chính
- Hiệu suất không trễ: Giảm độ trễ vốn có trong các trung bình động truyền thống, cung cấp tín hiệu nhanh hơn cho các thay đổi xu hướng.
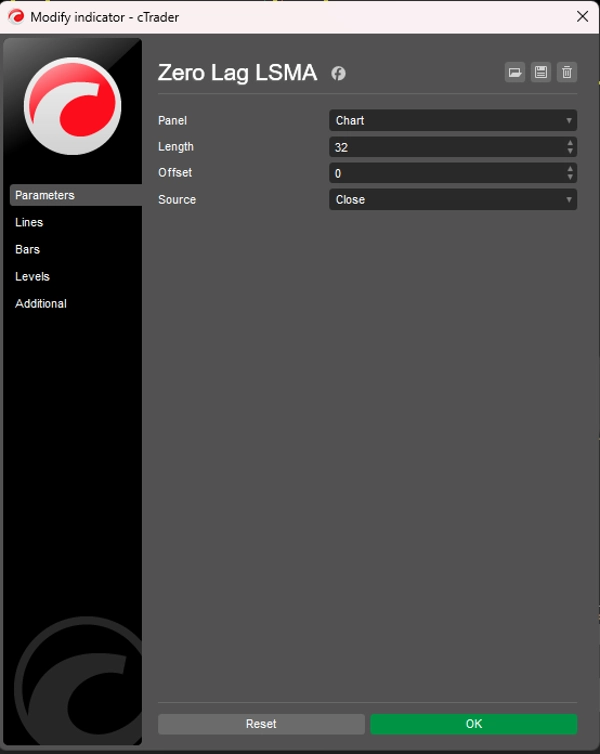
- Tham số tùy chỉnh: Điều chỉnh độ dài, độ lệch và nguồn giá (Mở, Cao, Thấp, Đóng) để phù hợp với chiến lược giao dịch của bạn.
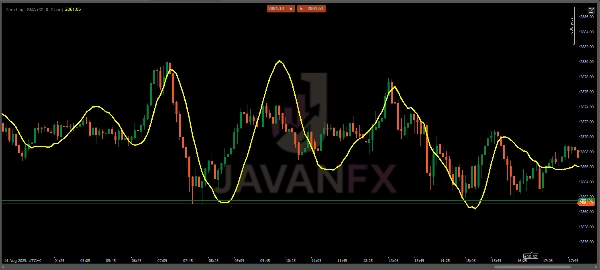
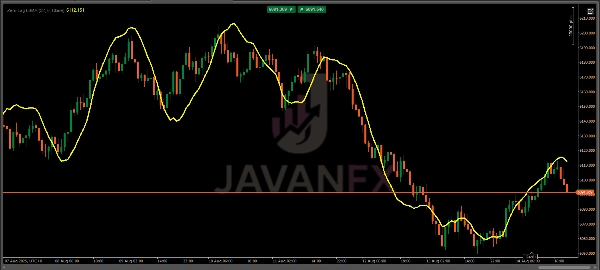
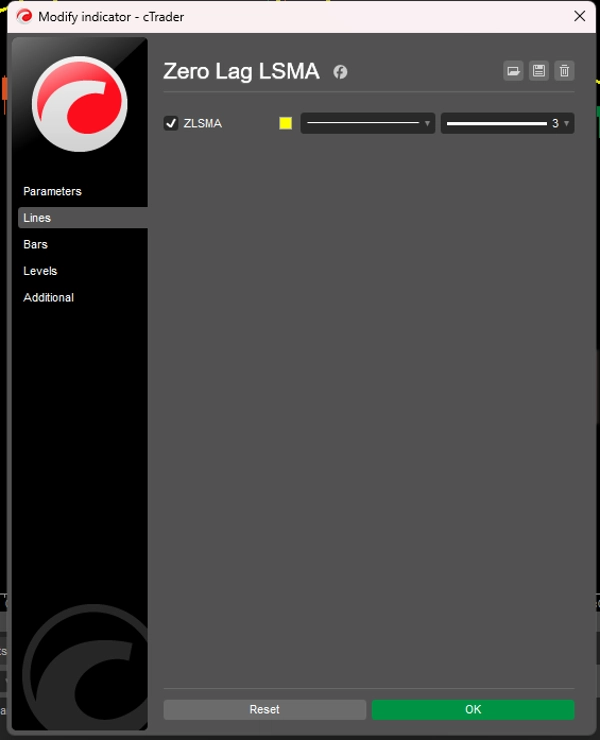
- Trực quan dễ hiểu: Hiển thị dưới dạng một đường màu vàng mượt mà phủ lên biểu đồ giá để dễ dàng diễn giải.
- Ứng dụng đa dạng: Phù hợp cho scalping, giao dịch trong ngày, giao dịch swing và các chiến lược dài hạn trên nhiều khung thời gian khác nhau.
Cách sử dụng
- Xác định xu hướng:
-
- Khi đường ZLSMA dốc lên, điều đó cho thấy xu hướng tăng.
- Đường dốc xuống cho thấy xu hướng giảm.
- Chuyển động phẳng hoặc dao động có thể cho thấy sự tích lũy hoặc thiếu xu hướng.
- Tín hiệu vào/ra:
-
- Tín hiệu mua: Vào vị thế mua khi giá cắt lên trên đường ZLSMA, đặc biệt sau một xu hướng tăng đã được xác nhận.
- Tín hiệu bán: Vào vị thế bán khi giá cắt xuống dưới đường ZLSMA trong xu hướng giảm.
- Tín hiệu thoát: Cân nhắc thoát khi giá cắt trở lại qua đường ZLSMA hoặc khi đường này trở nên phẳng, báo hiệu khả năng đảo chiều xu hướng.
- Xác nhận:
-
- Kết hợp ZLSMA với các chỉ báo khác (ví dụ: RSI, MACD) hoặc các mức hỗ trợ/kháng cự để xác nhận tín hiệu và tránh các phá vỡ giả.
- Sử dụng trên các khung thời gian cao hơn (H1, H4, D1) để có tín hiệu xu hướng mạnh hơn hoặc khung thời gian thấp hơn (M5, M15) cho scalping.
Chiến lược giao dịch
- Theo xu hướng: Sử dụng ZLSMA để theo xu hướng mạnh bằng cách vào lệnh khi giá hồi về đường ZLSMA theo hướng xu hướng.
- Giao dịch đảo chiều: Tìm sự phân kỳ giá so với đường ZLSMA kết hợp với các mẫu nến (ví dụ: nến pin bar, nến engulfing) để thiết lập điểm đảo chiều.
- Giao dịch phá vỡ: Theo dõi các điểm phá vỡ giá trên/dưới đường ZLSMA trong các giai đoạn biến động cao để tìm điểm vào lệnh tiềm năng.
Mẹo sử dụng tối ưu
- Điều chỉnh độ dài theo điều kiện thị trường: Sử dụng độ dài ngắn hơn (ví dụ: 10-20) cho thị trường nhanh hoặc scalping, và độ dài dài hơn (ví dụ: 50-100) cho xu hướng mượt mà hơn trên các khung thời gian cao hơn.
- Kiểm tra trên tài khoản demo: Trước khi sử dụng trong giao dịch thực, hãy thử nghiệm ZLSMA trên tài khoản demo để hiểu cách nó hoạt động trong các thị trường bạn ưa thích.
- Tránh giao dịch quá mức trong thị trường dao động: ZLSMA hoạt động tốt nhất trong các thị trường có xu hướng; sử dụng các bộ lọc bổ sung (ví dụ: ADX) để tránh các tín hiệu nhiễu trong thị trường đi ngang.
Tóm tắt
Tóm tắt AI
The Zero Lag LSMA (Least Squares Moving Average) is a technical indicator designed to enhance trend analysis by minimizing the lag typical of traditional moving averages. It uses a double linear regression process to provide faster and more responsive signals, making it suitable for real-time identification of trend direction and potential reversals. The indicator is applicable across various markets including forex, stocks, and commodities.
Key features include customizable parameters such as length, offset, and price source (Open, High, Low, Close), allowing adaptation to different trading strategies. It displays as a smooth yellow line overlaid on the price chart for clear visual interpretation. The indicator supports multiple trading styles and timeframes, from scalping to long-term strategies.
Traders use the Zero Lag LSMA to identify trends by observing the slope of the line: upward for bullish trends, downward for bearish, and flat for consolidation. Entry and exit signals are generated when price crosses the LSMA line, with additional confirmation recommended through other indicators or support/resistance levels. The indicator supports trend following, reversal, and breakout trading strategies, with adjustable settings to optimize performance under varying market conditions.
Hồ sơ chỉ báo
Đánh giá của khách hàng
4.6
Đánh giá: 3
5 | 67 % | |
4 | 33 % | |
3 | 0 % | |
2 | 0 % | |
1 | 0 % |
Đánh giá của khách hàng
October 10, 2025
Zero lag, full clarity ⚡ LSMA tracks price action like a scalpel — sharp, fast, and smooth. Great trend filter for any timeframe!
August 27, 2025
The only reason it stays interesting is the setup needs less second guessing. A normal demo run is enough to see the weak spots.
August 16, 2025
Not bad if the rules are already clear. Spread and slippage need a line in the notes.
Thảo luận
Câu hỏi thường gặp
Các sản phẩm có sẵn trên cTrader Store, bao gồm bot giao dịch, chỉ báo và plugin, được cung cấp bởi các nhà phát triển bên thứ ba và chỉ nhằm mục đích cung cấp thông tin và tiếp cận kỹ thuật. cTrader Store không phải là nhà môi giới và không cung cấp lời khuyên đầu tư, khuyến nghị cá nhân hay bất kỳ đảm bảo nào về hiệu suất trong tương lai.


Giá
Kể từ 14/07/2025
59
Lượt bán