
Mô tả
Bản Đồ Tương Quan – Công Cụ Thiết Yếu Cho Những Hiểu Biết Thị Trường Của Bạn
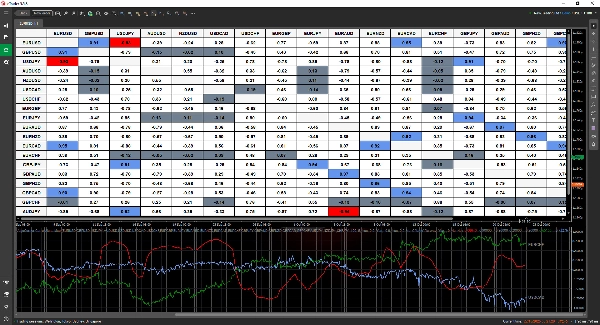
Bản Đồ Tương Quan là một chỉ báo mạnh mẽ nhưng trực quan được thiết kế để giúp bạn khám phá các mối quan hệ giữa các tài sản chỉ trong nháy mắt. Với định dạng bảng dễ đọc, bạn có thể nhanh chóng phát hiện các tương quan và đưa ra quyết định giao dịch thông minh hơn.
✅ Tùy Chỉnh Phân Tích Của Bạn – Chọn và so sánh nhiều cặp giao dịch theo giới hạn của nền tảng bạn sử dụng.
✅ Khung Thời Gian Linh Hoạt – Phân tích các tương quan trên bất kỳ khung thời gian nào phù hợp với chiến lược của bạn.
✅ Hiển Thị Rõ Ràng & Thích Ứng – Lựa chọn giữa định dạng thập phân (-1 đến 1) hoặc phần trăm (-100% đến 100%).
✅ Đánh Dấu Thông Minh – Dễ dàng nhận biết các tương quan mạnh và yếu với mã màu tùy chỉnh.
✅ Cảnh Báo Thời Gian Thực – Luôn đi trước với thông báo khi giá trị tương quan thay đổi đáng kể.
✅ Dữ Liệu Tương Tác – Nhấp vào bất kỳ ô nào để theo dõi cách các tương quan phát triển theo thời gian.
✅ Cải Tiến Liên Tục – Tận hưởng các cập nhật trong tương lai mà không mất thêm phí.
Khám phá các mối quan hệ thị trường then chốt và hoàn thiện chiến lược giao dịch của bạn với Bản Đồ Tương Quan! 🚀
Tóm tắt
Key features include customizable display options with correlation values shown in decimal (-1 to 1) or percentage (-100% to 100%) formats, and smart color-coded highlighting to quickly identify strong or weak correlations. Users can interact with the data by clicking on any cell to track how correlations evolve over time. Real-time alerts notify users of significant changes in correlation values, aiding timely decision-making.
This tool is intended to help traders uncover relationships between assets efficiently, supporting more informed market analysis and strategy refinement.
Đánh giá của khách hàng
5 | 67 % | |
4 | 33 % | |
3 | 0 % | |
2 | 0 % | |
1 | 0 % |


