
Mô tả
MarketSessions – Lợi Thế Giao Dịch Của Bạn, Được Trực Quan Hóa
Biến Thời Gian Thị Trường Thành Sức Mạnh Giao Dịch
MarketSessions là một chỉ báo cTrader chuyên nghiệp mang đến các phiên thị trường toàn cầu sống động — để bạn có thể giao dịch nơi đà tăng thực sự và thời điểm trở thành lợi thế của bạn.
🚀 Tại Sao Các Nhà Giao Dịch Tin Tưởng MarketSessions
Nhìn Thấy Nhịp Điệu Thị Trường
Ngay lập tức trực quan hóa London, New York, Tokyo, Sydney – và bất kỳ phiên nào bạn muốn – với các lớp phủ sạch sẽ, tinh tế thích ứng với biểu đồ của bạn.
Giao Dịch Thông Minh Hơn, Không Phải Muộn Hơn
Nhận thông báo thời gian thực khi các phiên mở, đóng hoặc đạt các mức quan trọng – được gửi qua Telegram hoặc Discord (lựa chọn của bạn).
Tấn Công Các Vùng Có Xác Suất Cao
Tận dụng các công cụ tích hợp như Phá Vỡ Phạm Vi Mở Cửa, Điểm Kiểm Soát (POC) và các đường phiên chính xác để bạn không bao giờ bỏ lỡ một cú phá vỡ hoặc từ chối.
🎯 Tính Năng Chính
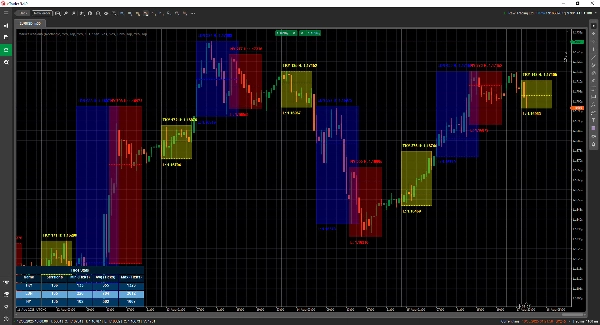
- Trực Quan Hóa & Quản Lý Phiên – thời gian, màu sắc và nhãn hoàn toàn tùy chỉnh, ngay cả với các thị trường chồng lấn
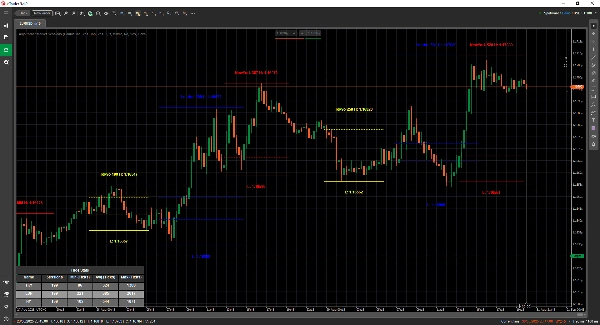
- Công Cụ Vẽ Nâng Cao – bao gồm các công cụ vẽ Đường Kép ❘❘ và Đường Giữa, hình chữ nhật phá vỡ, đánh dấu văn bản và một Chế Độ Đường Kép dành cho nhà giao dịch tối giản
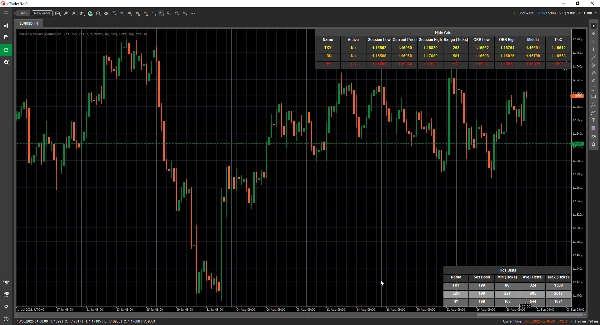
- Bảng Thống Kê – xem Tổng Số Phiên, phạm vi Min, Trung Bình và Max cho mỗi phiên (tính bằng Ticks, Pips hoặc %)
- Chế Độ Lưới - cho phép bạn xem các phiên đang hoạt động hiện tại trong một bảng, để bạn có thể xem các phiên ở khung thời gian cao hơn.
- Cấu Hình Linh Hoạt – tùy chỉnh vị trí văn bản, chế độ phạm vi, sở thích vẽ và chủ đề
- Cảnh Báo & Tích Hợp – tích hợp Telegram/Discord với cảnh báo âm thanh và hình ảnh
📦 Những Gì Bạn Nhận Được
- MarketSessions.algo (sẵn sàng sử dụng)
- Cập Nhật Trọn Đời (không phí định kỳ)
- Hỗ Trợ Thân Thiện (truy cập trực tiếp nếu bạn cần giúp đỡ)
💻 Yêu Cầu
- nền tảng cTrader
- runtime .NET 6.0
✅ Cài đặt trong vài phút
✅ Giao dịch với sự tự tin tuyệt đối
📘 Tham Khảo Tham Số (Phiên Bản Thân Thiện)
Danh Sách Các Phiên Có Sẵn
- New York
- London
- Frankfurt
- Tokyo
- Hong Kong
- Shanghai
- Singapore
- Wellington
- Sydney
- Toronto
Cài Đặt Chung
- Chế Độ Vẽ – Chọn cách các đường phiên được vẽ trên biểu đồ (Hình chữ nhật / Đường Kép / Đường Giữa)
- Hiển Thị Tên Phiên – Hiển thị tên của mỗi phiên trực tiếp trên biểu đồ của bạn
- Vị Trí Tên Phiên – Quyết định vị trí văn bản tên phiên xuất hiện (trên cùng, giữa, dưới cùng)
- Chữ Đậm – Làm cho tên phiên đậm hơn để dễ đọc hơn
- Khoảng Cách Văn Bản Trên Cùng – Thêm khoảng cách từ trên xuống (để văn bản không chồng lên nến)
- Khoảng Cách Văn Bản Dưới Cùng – Thêm khoảng cách từ dưới cùng của khu vực phiên
- Vị Trí Thời Gian Văn Bản – Hiển thị thời gian phiên cùng với tên phiên
- Sử Dụng Tên Phiên Ngắn – Chuyển sang tên ngắn hơn (ví dụ: NY thay vì New York)
- Hiển Thị Phạm Vi Phiên – Làm nổi bật phạm vi giá đầy đủ được bao phủ bởi phiên
- Chế Độ Phạm Vi Phiên – Chọn cách tính phạm vi giá (cao/thấp hoặc mở/đóng)
- Vị Trí Phạm Vi Phiên – Đặt dấu phạm vi ở trên cùng hoặc dưới cùng của phạm vi
- Hiển Thị Giá Cao – Hiển thị giá cao nhất của phiên
- Vị Trí Hiển Thị Giá Cao – Chọn vị trí nhãn Giá Cao xuất hiện
- Hiển Thị Giá Thấp – Hiển thị giá thấp nhất của phiên
- Vị Trí Hiển Thị Giá Thấp – Chọn vị trí nhãn Giá Thấp xuất hiện
- Kéo Dài Đường Cao/Thấp (Phút) - Cho phép kéo dài các đường này thêm x phút về phía trước
- Hiển Thị Phá Vỡ Phạm Vi Mở Cửa – Vẽ một hộp phá vỡ tại điểm mở phiên
- Kéo Dài Đường ORB (Phút) - Cho phép kéo dài các đường này thêm x phút về phía trước
- Hiển Thị Đường Giữa – Thêm các đường giữa để giúp xác định giá trị công bằng
- Kéo Dài Đường Giữa (Phút) - Cho phép kéo dài đường này thêm x phút về phía trước
- Hiển Thị PoC – Hiển thị Điểm Kiểm Soát (giá được giao dịch nhiều nhất trong phiên)
- Kéo Dài Đường Giữa (Phút) - Cho phép kéo dài đường này thêm x phút về phía trước
- Độ Trong Suốt Khi Tô Màu – Kiểm soát độ trong suốt của phần nền tô trong phiên
Thống Kê
- Vẽ Thống Kê – Hiện/ẩn bảng thống kê trên biểu đồ của bạn
- Căn Chỉnh Ngang Bảng Thống Kê – Căn bảng (Trái / Giữa / Phải)
- Căn Chỉnh Dọc Bảng Thống Kê – Chọn bảng xuất hiện ở trên cùng hoặc dưới cùng
- Màu Tiêu Đề – Màu văn bản cho tiêu đề “Thống Kê”
- Màu Hàng Chẵn – Màu nền cho các hàng số chẵn trong bảng
- Màu Hàng Lẻ – Màu nền cho các hàng số lẻ trong bảng
- Màu Tiền Cảnh – Màu văn bản sử dụng bên trong bảng
Telegram
- Sử Dụng – Bật hoặc tắt cảnh báo Telegram
- Token – Token Bot Telegram của bạn
- ChatId – ID cuộc trò chuyện nơi cảnh báo sẽ được gửi
Discord
- Sử Dụng – Bật hoặc tắt cảnh báo Discord
- WebhookUrl – URL webhook Discord để gửi cảnh báo phiên
Cảnh Báo Âm Thanh
- Cảnh Báo Âm Thanh Phiên Mới – Phát âm thanh khi một phiên mới bắt đầu
- Cảnh Báo Âm Thanh Phiên Kết Thúc – Phát âm thanh khi một phiên kết thúc
Lưới
- Ép Lưới - Ép hiển thị lưới bất kể khung thời gian được sử dụng
- Lưới Hiển Thị Cho Khung Thời Gian Trở Lên - Cho phép bạn chọn khung thời gian và các khung lớn hơn để lưới hiển thị
- Thông Báo Hộp Tin Nhắn - Thông báo lý do chế độ hiển thị bình thường không khả thi và chuyển sang Chế Độ Lưới
- Căn Chỉnh Ngang Lưới
- Căn Chỉnh Dọc Lưới
Ví Dụ Phiên (New York)
⚠️ Các tham số tương tự áp dụng cho mỗi phiên (London, Tokyo, Sydney, v.v.)
- Hoạt Động – Bật hoặc tắt phiên cụ thể này
- Màu Sắc – Màu phiên được sử dụng trên biểu đồ
- Tô Vùng – Tô nền khu vực phiên
- Kiểu Đường – Chọn kiểu đường (liền, nét đứt, v.v.)
- Độ Dày Đường – Điều chỉnh độ dày của viền phiên
Hãy biến đồng hồ thị trường thành đồng minh của bạn
Hãy sở hữu MarketSessions ngay hôm nay và không bao giờ bỏ lỡ một phiên sinh lời nữa.
Tóm tắt
Users can view comprehensive session statistics, including total sessions, minimum, average, and maximum ranges measured in ticks, pips, or percentages. A grid mode enables viewing active sessions in a table format suitable for higher timeframes. The indicator supports real-time alerts via Telegram or Discord for session openings, closings, and key levels, complemented by sound and visual notifications.
Additional configurable options include display preferences for session names, price ranges, high/low prices, opening range breakouts, middle lines, and the Point of Control (most traded price). The indicator requires the .NET 6.0 runtime and offers lifetime updates and support. It is applicable to major forex symbols such as EURUSD, GBPUSD, NZDUSD, and USDJPY.
Đánh giá của khách hàng
5 | 100 % | |
4 | 0 % | |
3 | 0 % | |
2 | 0 % | |
1 | 0 % |


