
Mô tả
Chỉ số Khả năng Giao dịch Đa Khung thời gian
Chỉ số Khả năng Giao dịch Đa Khung thời gian là một công cụ phân tích điều kiện thị trường tiên tiến giúp xác định khi nào thị trường có lợi về mặt thống kê để giao dịch. Thay vì tạo ra các tín hiệu mua hoặc bán, nó đo lường mức độ có thể giao dịch của các điều kiện thị trường hiện tại trên nhiều khung thời gian, cho phép bạn tập trung chỉ vào những khoảng thời gian mà hành động giá rõ ràng, có hướng và có khả năng tạo ra các biến động có ý nghĩa.
Không giống như các chỉ báo truyền thống dựa trên các ngưỡng cố định, chỉ báo này liên tục thích ứng với từng khung thời gian bằng cách so sánh hành vi thị trường hiện tại với đường cơ sở lịch sử của chính nó. Phương pháp tự hiệu chỉnh này cho phép nó hoạt động trên Forex, chỉ số, hàng hóa, tiền điện tử và các thị trường CFD khác mà không cần tối ưu hóa thủ công.
Cách hoạt động
Chỉ báo đánh giá sáu đặc điểm độc lập của thị trường trên mỗi khung thời gian.
Xu hướng so với ngẫu nhiên sử dụng Chỉ số Độ trung bình Thị trường.
Độ mượt mà so với độ lộn xộn sử dụng Kích thước Fractal.
Tỷ lệ tín hiệu trên nhiễu để xác định liệu các dao động có ý nghĩa có chiếm ưu thế so với các biến động ngẫu nhiên.
Độ sạch của xu hướng bằng cách đo lường mức độ hiệu quả của chuyển động giá thay vì liên tục đảo chiều.
Tần suất cơ hội giao dịch bằng cách đếm các chân dao động quan trọng.
Tiến trình hướng ròng để xác định liệu giá có đang tiến triển có ý nghĩa thay vì liên tục hồi lại.
Mỗi yếu tố được chuẩn hóa tương đối so với hành vi lịch sử của chính nó bằng cách sử dụng phân tích điểm z thống kê. Điều này có nghĩa là chỉ báo đánh giá liệu các điều kiện hiện tại có bất thường thuận lợi thay vì chỉ đơn giản là trên hoặc dưới một ngưỡng tùy ý.
Các yếu tố đã chuẩn hóa được kết hợp thành một điểm số có trọng số từ 0 đến 100.
Chỉ báo cũng bao gồm một bộ lọc chi phí giao dịch để ngăn các khung thời gian ngắn nhận điểm cao khi các dao động giá trung bình quá nhỏ để thực tế vượt qua chênh lệch giá và hoa hồng.
Bảng điều khiển
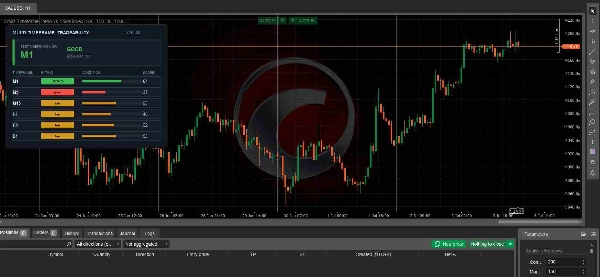
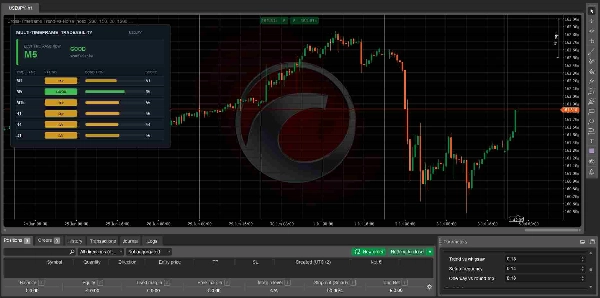
Bảng điều khiển phân tích sáu khung thời gian cùng lúc.
M1
M5
M15
H1
H4
D1
Mỗi khung thời gian nhận một trong ba đánh giá.
TỐT biểu thị điều kiện thị trường rất thuận lợi.
TRUNG BÌNH biểu thị điều kiện chấp nhận được nhưng kém lý tưởng hơn.
KÉM biểu thị cấu trúc thị trường hiện tại không thuận lợi.
Chỉ báo tự động làm nổi bật khung thời gian có điểm số cao nhất cùng với Điểm Khả năng Giao dịch hiện tại của nó.
Giải thích các Điểm số
80 đến 100 biểu thị điều kiện giao dịch xuất sắc với chuyển động hướng mạnh và nhiễu thị trường thấp.
60 đến 79 biểu thị điều kiện rất tốt nơi các chiến lược giao dịch có khả năng hoạt động hiệu quả.
40 đến 59 biểu thị điều kiện trung bình nơi nên chọn lọc.
Dưới 40 biểu thị cấu trúc thị trường kém với độ ngẫu nhiên quá mức, lộn xộn hoặc chuyển động không đủ.
Điểm số cao hơn không dự đoán hướng thị trường. Chúng chỉ đơn giản cho biết hướng nào phát triển có khả năng thống kê cao hơn để tạo ra hành động giá sạch hơn và dễ giao dịch hơn.
Các Tham số Chính
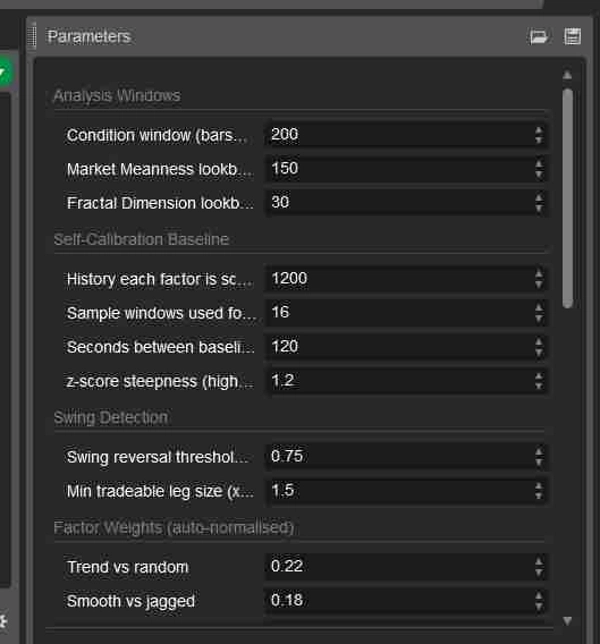
Cửa sổ phân tích kiểm soát lượng lịch sử thị trường được sử dụng để tính toán mỗi yếu tố.
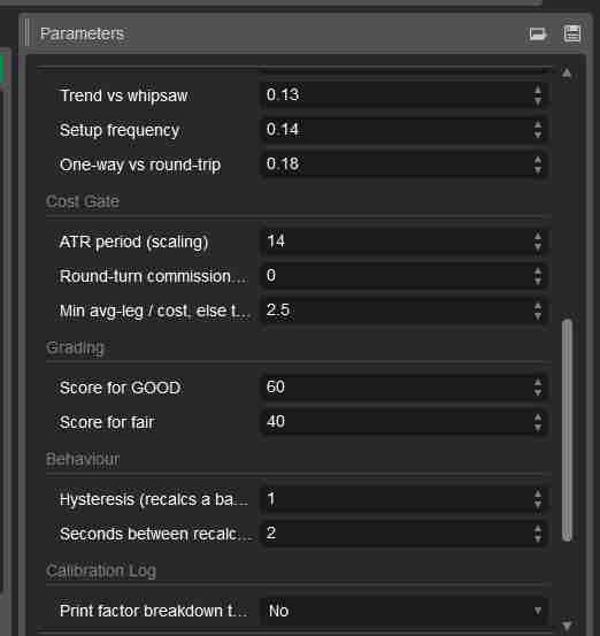
Đường cơ sở tự hiệu chỉnh xác định cách chuẩn hóa lịch sử được thực hiện.
Phát hiện dao động điều chỉnh độ nhạy được sử dụng để xác định các dao động giá quan trọng.
Trọng số yếu tố cho phép người dùng nâng cao nhấn mạnh hoặc giảm tầm quan trọng của mỗi đặc điểm thị trường.
Cổng chi phí kiểm soát mức độ chi phí giao dịch ảnh hưởng đến đánh giá cuối cùng.
Cài đặt phân loại xác định ngưỡng điểm cho các phân loại TỐT và TRUNG BÌNH.
Cài đặt bảng điều khiển cho phép kiểm soát hoàn toàn kích thước bảng và vị trí màn hình.
Trường hợp Sử dụng Tốt nhất
Tìm khung thời gian có khả năng giao dịch cao nhất trước khi tìm điểm vào lệnh.
Tránh các điều kiện thị trường đi ngang, ồn ào hoặc chất lượng thấp.
Lọc tín hiệu từ các chiến lược giao dịch hiện có.
Cải thiện giao dịch tùy ý bằng cách chỉ tập trung vào các môi trường thuận lợi về mặt thống kê.
Hỗ trợ các hệ thống thuật toán với bộ lọc điều kiện thị trường thích ứng.
Dành cho ai
Chỉ báo này phù hợp cho người mới bắt đầu muốn có hướng dẫn khách quan về khi nào điều kiện thị trường thuận lợi, cũng như các nhà giao dịch tùy ý và thuật toán có kinh nghiệm đang tìm kiếm bộ lọc chất lượng thị trường thích ứng hoạt động trên nhiều công cụ và khung thời gian.
Lưu ý Quan trọng
Chỉ báo này không phải là bộ tạo tín hiệu mua hoặc bán.
Nó không dự đoán hướng giá trong tương lai.
Nó chỉ đo lường chất lượng của các điều kiện thị trường hiện tại.
Để có kết quả tốt nhất, hãy kết hợp nó với chiến lược vào lệnh, thoát lệnh và quản lý rủi ro hiện có của bạn. Các giao dịch có xác suất cao nhất thường xảy ra khi thiết lập giao dịch của bạn phù hợp với các khung thời gian nhận được đánh giá Khả năng Giao dịch TỐT.
Tóm tắt
The indicator provides a weighted Tradeability Score from 0 to 100 for six timeframes (M1, M5, M15, H1, H4, D1), classifying each as GOOD, FAIR, or POOR based on current market quality. It includes a transaction cost filter to account for realistic trading conditions on shorter timeframes. The dashboard highlights the highest scoring timeframe and its score, helping traders focus on periods with clean, directional price action suitable for trading.
This tool does not generate buy or sell signals nor predict price direction; instead, it serves as a market quality filter to improve discretionary or algorithmic trading by signaling when conditions are statistically favorable. Key parameters allow customization of analysis windows, swing detection sensitivity, factor weights, and grading thresholds. It is suitable for traders seeking objective guidance on market structure and tradeability across multiple instruments and timeframes.