


Description
Atomic Analyst brings trend context, trade planning and multi-timeframe analysis into one interactive cTrader indicator. Its movable on-chart panel helps you review the market before deciding whether to act.
READ THE TREND
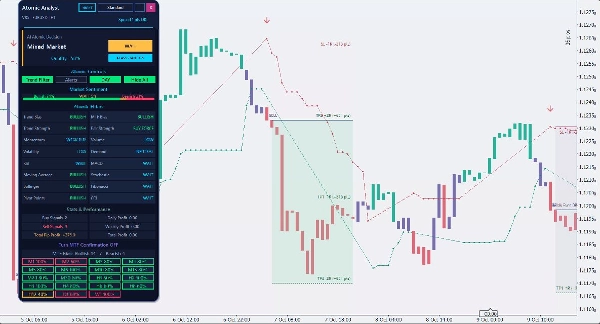
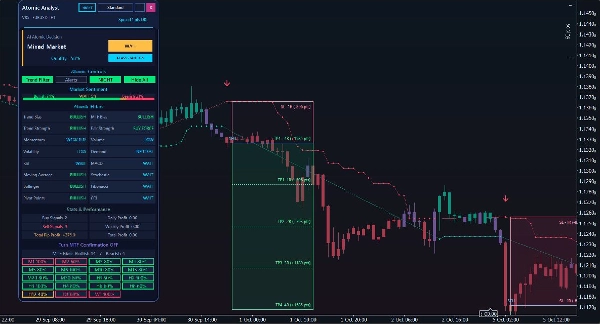
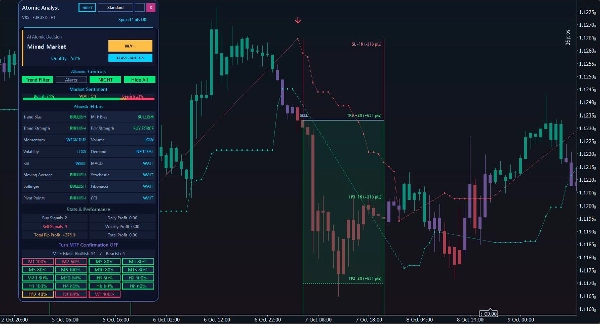
Use Trend Filter to focus on trend-based buy and sell signals. Review trend bias, strength, momentum, volatility and the supporting technical filters together. Multi-timeframe cells provide additional context across supported chart periods.
PLAN THE TRADE VISUALLY
See the indicated entry, stop-loss and reward levels directly on the chart. Transparent trade-glass boxes keep the candlesticks visible while showing the analytical plan and its historical progress. Target, break-even and stop outcomes help you review how a selected setup developed.
KEEP YOUR WORKSPACE CLEAR
Move or collapse the panel, choose its display size, and use day, night or custom chart themes. Toggle chart visuals and alerts from the panel. Desktop popup, sound and configurable email alerts are available; email requires your cTrader email settings.
GET STARTED
Attach Atomic Analyst to a cTrader Windows time-based chart and allow its history to finish loading. H1 is a practical starting point for reviewing the examples supplied here. Select Trend Filter, inspect the signal and its risk levels, and assess the wider market before making your own decision. The gallery uses EURUSD H1; broker data, settings, spread and trading costs can change the results you see. Test your chosen instrument and settings on a demo account first.
UNDERSTAND THE DISPLAY
Atomic Analyst is an analysis indicator; it does not place trades for you. The AI Assistant and quality reading summarize technical agreement, not a probability of profit. Historical trade-glass results are analytical illustrations, not verified account returns or an execution backtest. The gallery deliberately selects winning examples to demonstrate the interface; losing and break-even signals also occur. The panel shows its current market assessment even when the chart is scrolled into the past.
Trading involves risk. Past performance does not guarantee future results.
Summary
Users can customize the panel’s position, size, and theme (day, night, or custom) to maintain a clear workspace. The panel also supports toggling chart visuals and alerts, including desktop popups, sounds, and configurable email notifications (email setup required in cTrader). Atomic Analyst attaches to time-based charts, with H1 recommended for initial use, and requires the chart history to load fully before analysis.
This indicator serves as an analytical tool and does not execute trades. It summarizes technical agreement rather than predicting profit probabilities. Historical trade-glass results illustrate past setups but do not represent verified returns or backtests. Atomic Analyst supports key level analysis and trend strength signals, providing visualization and signal outputs based on bar data.
Discussion
Customer reviews
5 | 50 % | |
4 | 50 % | |
3 | 0 % | |
2 | 0 % | |
1 | 0 % |
FAQ







Price