
Mô tả
Coppock Curve là gì?
Coppock Curve là một chỉ báo động lượng dài hạn được thiết kế ban đầu để xác định đáy thị trường chính trong S&P 500. Nó được tạo ra vào năm 1962 bởi nhà kinh tế học Edwin Coppock, người đã được Giáo hội Episcopal nổi tiếng yêu cầu tìm cơ hội mua vào rủi ro thấp cho quỹ tài trợ của họ.
Nói một cách đơn giản, nó là một bộ dao động theo xu hướng cho bạn biết khi nào thị trường gấu có khả năng đã chạm đáy và một thị trường bò mới đang bắt đầu.
“Bí quyết” (Cách nó hoạt động)
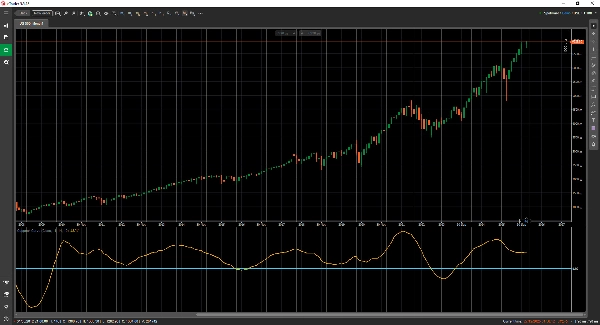
Không giống như nhiều chỉ báo hay nhạy cảm và phản ứng nhanh, Coppock Curve được thiết kế chậm rãi. Nó được tính bằng cách lấy Trung bình Trọng số Động (WMA) của tổng hai Tỷ lệ Thay đổi (ROC) khác nhau.
Coppock = WMA(10) của (ROC(14) + ROC(11))
Logic:
Nó đo lường tốc độ thay đổi động lượng giá trong các khoảng thời gian dài (thường là 11 và 14 tháng). Bằng cách làm mượt dữ liệu này với trung bình trọng số, nó lọc gần như toàn bộ tiếng ồn thị trường ngắn hạn.
Sự thật thú vị:
Coppock được cho là đã hỏi các giám mục mất bao lâu để một người hồi phục sau nỗi đau mất người thân. Họ nói “11 đến 14 tháng.” Ông đã áp dụng cùng khung thời gian đó cho thị trường, lý luận rằng tâm lý thị trường theo chu kỳ đau buồn và hồi phục tương tự.
Tại sao nó hữu ích?
Các nhà giao dịch và nhà đầu tư yêu thích Coppock Curve vì ba lý do chính:
- Nó lọc tiếng ồn: Vì nó được tính trên khung thời gian hàng tháng (theo truyền thống), nó bỏ qua biến động ngày này qua ngày khác hoặc thậm chí tuần này qua tuần khác. Nó không kích hoạt thường xuyên, nhưng khi kích hoạt thì thường có ý nghĩa lớn.
- Tín hiệu mua rõ ràng: Tín hiệu là nhị phân và dễ đọc. Tín hiệu “Mua” được tạo ra khi đường cong nằm dưới đường số không và bắt đầu đi lên (bắt đầu tăng).
- Mỏ neo tâm lý: Nó ngăn bạn cố gắng “bắt dao rơi.” Nó buộc bạn phải chờ cho đến khi động lượng đã chuyển từ âm sang dương về mặt toán học trước khi vào vị thế.
Khi nào nên sử dụng
- Phù hợp nhất cho: Đầu tư dài hạn, phân bổ hưu trí và xác định sự khởi đầu của một đợt tăng giá mới.
- Không phù hợp cho: Giao dịch trong ngày hoặc bán khống. Nó không được thiết kế để xác định tín hiệu bán hoặc đỉnh thị trường.


