
AlgoCorner 1-100 Moving Averages
Indikator
137 muat turun
Versi 1.1, Jan 2026
Windows, Mac
5.0
Ulasan: 1
Penerangan
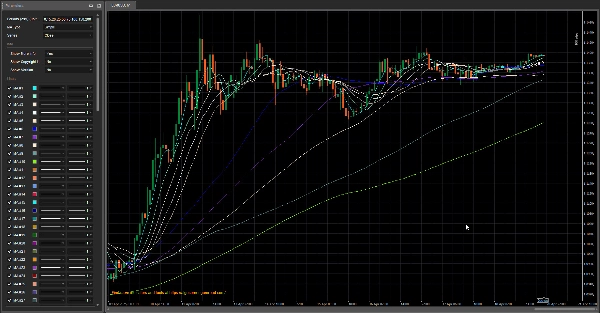
Penunjuk ini membantu anda melukis banyak purata bergerak hanya dengan menaip tempoh dalam format CSV (nilai dipisahkan koma), dan sehingga 100 purata bergerak dibenarkan.
Daripada menambah purata bergerak satu persatu, anda boleh menggunakan alat berguna ini untuk melukis banyak dengan sedikit usaha.
Kesemua 100 daripadanya boleh disesuaikan sepenuhnya.
Warna untuk setiap MA disusun mengikut abjad.
Ringkasan
Profil indikator
Ulasan pelanggan
5.0
Ulasan: 1
5 | 100 % | |
4 | 0 % | |
3 | 0 % | |
2 | 0 % | |
1 | 0 % |
Ulasan pelanggan
October 2, 2025
Love MAs? This tool lets you stack up to 100 on your chart! Great for trend hunting and system testing. Just don’t overload it – too many lines can turn your chart into spaghetti.
Perbincangan
Soalan Lazim
Forex
Signal
Supertrend
Produk yang tersedia melalui cTrader Store, termasuk bot dagangan, indikator dan plugin, disediakan oleh pembangun pihak ketiga dan diberikan akses untuk tujuan maklumat dan teknikal sahaja. cTrader Store bukan broker dan tidak memberikan nasihat pelaburan, syor peribadi atau sebarang jaminan prestasi masa hadapan.


![Logo "[Stellar Strategies] MARSI Signal Plotter"](https://cdn.ctrader.com/image/webp/7b2b8da6-8f8e-4646-8d4a-4710c516c01e_25567)


Harga
10
Jualan
347
Pemasangan percuma