
AlgoCorner McGinley Dynamic
Indikator
60 muat turun
Versi 1.1, Jan 2026
Windows, Mac
Penerangan
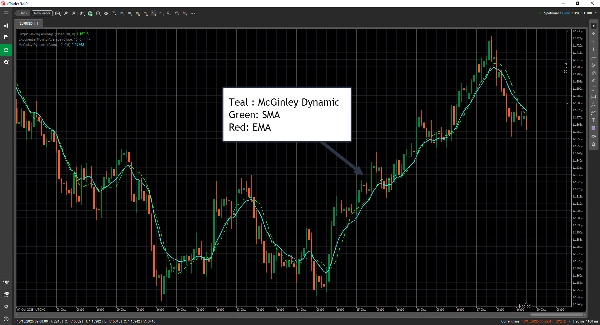
McGinley Dynamic adalah salah satu alat teknikal yang kurang dihargai yang sebenarnya berasal dari pemerhatian yang sangat praktikal mengenai purata bergerak.
Ia dicipta oleh John R. McGinley, CMT, dan tujuan utamanya adalah untuk menyelesaikan masalah biasa purata bergerak tradisional — iaitu, kelewatan dan whipsaw yang disebabkan oleh turun naik kelajuan pasaran.
Ini adalah apa yang ia cuba tangani secara khusus:
🧩 1. Kelewatan dalam purata bergerak
- Purata bergerak biasa (SMA, EMA) tertinggal di belakang harga kerana ia berdasarkan tempoh pandangan semula yang tetap.
- McGinley Dynamic secara automatik menyesuaikan pelicinnya berdasarkan kelajuan pasaran.
Apabila pasaran bergerak dengan cepat, ia mempercepat penyesuaiannya; apabila pasaran perlahan, ia melicinkan dengan lebih lembut.
👉 Hasil: ia mengikuti harga dengan lebih rapat tanpa bertindak berlebihan.
🌪️ 2. Whipsaw semasa tempoh tidak stabil
- Purata bergerak tradisional boleh memberikan isyarat palsu dalam pasaran yang bergelora.
- McGinley memperkenalkan penyebut dinamik yang menyesuaikan mengikut kadar pasaran bergerak.
Ini membantu mengurangkan bunyi dan mengelakkan isyarat persilangan yang tidak perlu.
⚙️ 3. Kelakuan yang lebih licin dan membetulkan diri
- Ia bertindak hampir seperti purata bergerak yang menyesuaikan diri secara automatik, bermakna anda tidak perlu melaras tempoh dengan terlalu banyak.
- Ini menjadikannya kurang sensitif terhadap input pengguna dan turun naik pasaran — seolah-olah purata bergerak “pintar”.
Ringkasan
Ringkasan AI
AlgoCorner McGinley Dynamic is a technical indicator designed to improve upon traditional moving averages by reducing lag and false signals. Created by John R. McGinley, CMT, it automatically adjusts its smoothing based on market speed, allowing it to track price movements more closely without overreacting. The indicator employs a dynamic denominator that changes in proportion to market velocity, helping to minimize whipsaws and avoid unnecessary crossover signals during volatile or choppy market conditions. Acting as a self-correcting, auto-adjusting moving average, it requires less fine-tuning of parameters and is less sensitive to market volatility and user input. This makes it a practical tool for traders seeking a smoother, more responsive moving average that adapts naturally to changing market dynamics. It is applicable to Forex markets, including currency pairs such as EURUSD and GBPUSD.
Profil indikator
Ulasan pelanggan
0.0
Ulasan: 0
Ulasan pelanggan
Belum ada ulasan untuk produk ini. Anda sudah mencuba produk tersebut? Jadilah yang pertama untuk berkongsi pendapat anda!
Perbincangan
Soalan Lazim
Forex
EURUSD
GBPUSD
Produk yang tersedia melalui cTrader Store, termasuk bot dagangan, indikator dan plugin, disediakan oleh pembangun pihak ketiga dan diberikan akses untuk tujuan maklumat dan teknikal sahaja. cTrader Store bukan broker dan tidak memberikan nasihat pelaburan, syor peribadi atau sebarang jaminan prestasi masa hadapan.


Harga
11
Jualan
353
Pemasangan percuma