
AlgoCorner Crosshair Edge
Indikator
Versi 1.0, Apr 2025
Windows, Mac
5.0
Ulasan: 1
Penerangan
Crosshair Edge: Alat Visualisasi Data cTrader Terbaik
Dengan Crosshair Edge, alat yang kukuh yang meningkatkan visualisasi data pasaran di dalam platform cTrader, anda boleh meningkatkan analisis carta anda ke tahap yang lebih tinggi.
Interaksi Carta yang Dipertingkatkan
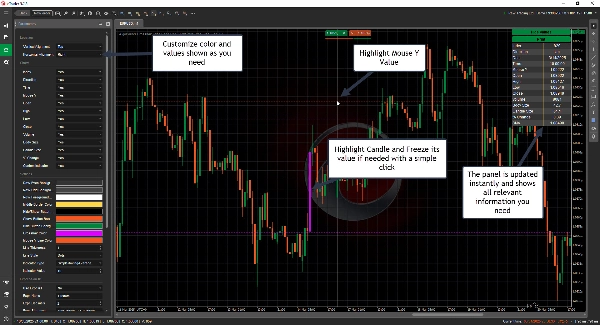
- Sorot bar semasa dan julatnya
- Bekukan crosshair pada lilin tertentu dengan satu klik, dan buka kunci semula dengan satu klik apabila diperlukan
- Hantar nilai ke log anda supaya ia boleh disalin dengan mudah
- Tunjuk atau sembunyikan susun atur mengikut keperluan
Penyesuaian Penuh
- Personalisasikan warna mengikut gaya anda
- Laraskan crosshair ke mana-mana lokasi yang anda perlukan di dalam carta
- Pilih nilai mana yang dipaparkan dan nilai mana yang harus diabaikan
Paparan Data Lilin Segera
Hanya gerakkan tetikus ke mana-mana lilin untuk memeriksa semua butirannya dan lebih lagi
- Indeks
- Arah
- Tarikh
- Masa
- Harga Y Tetikus
- Buka
- Tinggi
- Rendah
- Tutup
- Isipadu
- Saiz Badan
- Saiz Lilin
- % Perubahan
- Pelbagai nilai penunjuk
-
- ADX
- ATR
- Aliran Wang Chaikin
- EMA, HMA, SMA, TSMA, TMA, WMA
- Isipadu Seimbang
- RSI
- STD
- Tutup Berwajaran
- Pelicinan Welles Wilder
- Williams %R
- Lukis Garis Mendatar/Menegak dengan kekunci pintas mudah
-
- Lukis Garis Mendatar: Ctrl + 1
- Lukis Garis Menegak: Ctrl + 2
- Kekunci pintas boleh disesuaikan sepenuhnya
- Formula Boleh Disesuaikan
-
- Gunakan Buka, Tinggi, Rendah, Tutup, dan Indeks untuk mengira formula yang sesuai dengan keperluan anda
- Contoh, Harga Tipikal: (Tinggi[indeks] + Rendah[indeks] + Tutup[indeks])/3.0
Integrasi Lancar
- Lesen dipautkan kepada ID cTrader anda untuk kemudahan penggunaan
- Kemas kini masa depan disertakan
Tingkatkan pengalaman dagangan anda dengan Crosshair Edge hari ini! 🚀
Ringkasan
Profil indikator
Ulasan pelanggan
5.0
Ulasan: 1
5 | 100 % | |
4 | 0 % | |
3 | 0 % | |
2 | 0 % | |
1 | 0 % |
Ulasan pelanggan
Perbincangan
Soalan Lazim
Indices
RSI
ATR
Produk yang tersedia melalui cTrader Store, termasuk bot dagangan, indikator dan plugin, disediakan oleh pembangun pihak ketiga dan diberikan akses untuk tujuan maklumat dan teknikal sahaja. cTrader Store bukan broker dan tidak memberikan nasihat pelaburan, syor peribadi atau sebarang jaminan prestasi masa hadapan.


![Logo "[Hamster-Coder] Moving Average MTF"](https://cdn.ctrader.com/image/webp/b11b98b1-194d-4b8e-b00e-d611826ad159_31226)


![Logo "[Stellar Strategies] Market Session Ultimate"](https://cdn.ctrader.com/image/webp/61ffd537-0125-4246-9e72-42eca1791d64_28232)


Harga
10
Jualan
346
Pemasangan percuma