
Penerangan
Peta Korelasi– Alat Penting Anda untuk Wawasan Pasaran
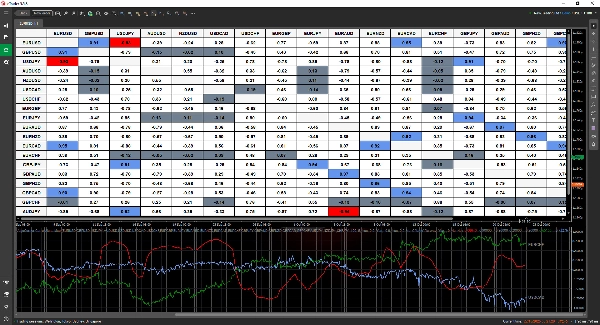
The Peta Korelasi adalah penunjuk yang kuat namun intuitif yang direka untuk membantu anda menemui hubungan antara aset dengan sekilas pandang. Dengan format jadual yang mudah dibaca, anda boleh dengan cepat mengenal pasti korelasi dan membuat keputusan perdagangan yang lebih bermaklumat.
✅ Sesuaikan Analisis Anda – Pilih dan bandingkan sebanyak mana pasangan dagangan yang dibenarkan oleh platform anda.
✅ Jangka Masa Fleksibel – Analisis korelasi merentasi mana-mana jangka masa untuk disesuaikan dengan strategi anda.
✅ Paparan Jelas & Boleh Disesuaikan – Pilih antara format perpuluhan (-1 hingga 1) atau peratusan (-100% hingga 100%).
✅ Penyorotan Pintar – Kenal pasti dengan mudah korelasi yang kuat dan lemah dengan pengekodan warna yang boleh disesuaikan.
✅ Amaran Masa Nyata – Kekal di hadapan dengan pemberitahuan apabila nilai korelasi berubah dengan ketara.
✅ Data Interaktif – Klik mana-mana sel untuk menjejaki bagaimana korelasi berkembang dari masa ke masa.
✅ Penambahbaikan Berterusan – Nikmati kemas kini masa depan tanpa kos tambahan.
Temui hubungan utama pasaran dan perhalusi strategi perdagangan anda dengan Peta Korelasi! 🚀
Ringkasan
Key features include customizable display options with correlation values shown in decimal (-1 to 1) or percentage (-100% to 100%) formats, and smart color-coded highlighting to quickly identify strong or weak correlations. Users can interact with the data by clicking on any cell to track how correlations evolve over time. Real-time alerts notify users of significant changes in correlation values, aiding timely decision-making.
This tool is intended to help traders uncover relationships between assets efficiently, supporting more informed market analysis and strategy refinement.
Ulasan pelanggan
5 | 67 % | |
4 | 33 % | |
3 | 0 % | |
2 | 0 % | |
1 | 0 % |


