Deskripsi
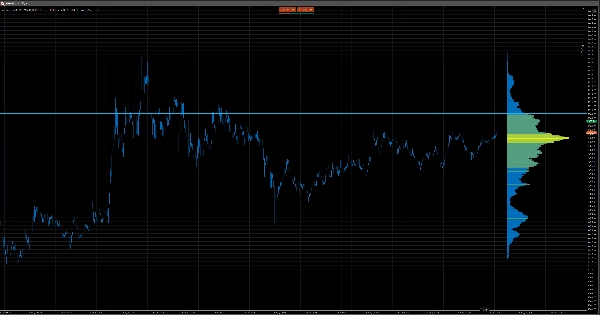
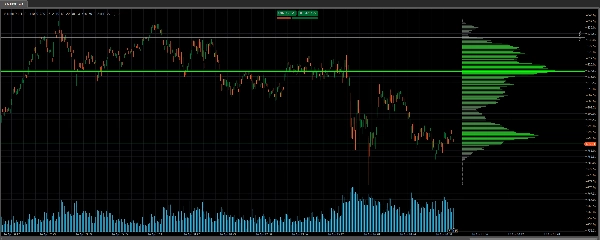
Volume Profile Pro v2 BARU adalah indikator Volume Profile sisi & rentang yang sangat dapat disesuaikan dan ringan untuk cTrader di mana Anda dapat mengatur banyak pengaturan sesuai preferensi Anda termasuk Titik Kontrol (POC), Nilai Area Tinggi (VAH) dan Nilai Area Rendah (VAL)
Apa Fungsinya
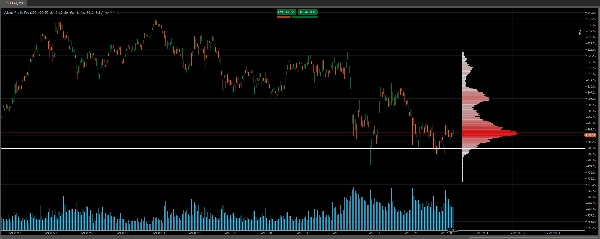
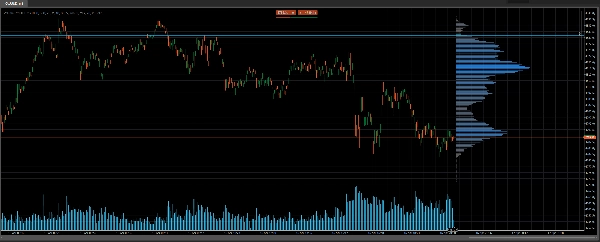
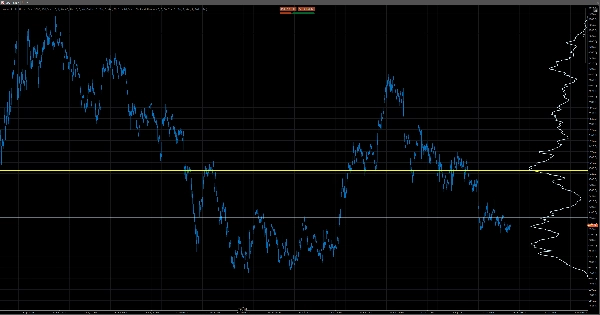
Volume Profile Pro menggambar histogram dinamis horizontal langsung di sisi kanan grafik cTrader Anda yang menunjukkan berapa banyak volume yang diperdagangkan pada setiap tingkat harga selama jendela waktu yang dapat dikonfigurasi. Alih-alih mengukur volume berdasarkan waktu, ia mengukur volume berdasarkan harga — secara instan mengungkapkan di mana pasar telah melakukan transaksi paling banyak. Dari sini, secara otomatis menghitung dan menggambar tiga level kunci: Titik Kontrol (POC), harga dengan volume perdagangan tertinggi; dan Nilai Area Tinggi (VAH) dan Nilai Area Rendah (VAL), batas rentang harga yang berisi 70% dari semua volume perdagangan (dapat dikonfigurasi).
Cara Kerjanya
Indikator memindai sejumlah bar historis yang ditentukan pengguna, menemukan rentang harga dari tertinggi ke terendah, dan membaginya menjadi baris harga yang berjarak rata. Volume tick setiap bar kemudian didistribusikan ke setiap baris harga yang dilaluinya. Hasilnya adalah histogram volume-berdasarkan-harga dengan lebar bar yang dapat disesuaikan proporsional dengan volume dan skema warna gradasi yang bergeser dari baris volume rendah ke tinggi. Ini berjalan sepenuhnya pada data OHLCV tingkat bar standar — tanpa umpan tick, tanpa DOM, tanpa sumber data eksternal — dan hanya menghitung ulang pada bar terakhir, menjaga kinerjanya cepat, ringan, dan tidak mengganggu.
Sangat Dapat Disesuaikan
Dengan Volume Profile Pro v2 hampir setiap elemen visual dan analitis dapat disesuaikan:
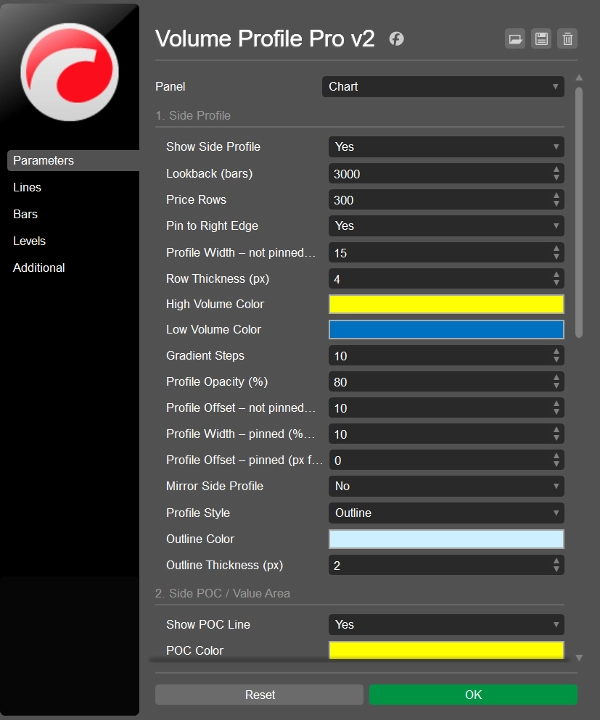
- Periode lookback dari profil sisi
- Jumlah baris harga & ketebalan baris
- Lebar profil
- Opasitas
- Skema warna gradasi
- Anda dapat membalik profil sisi
- Anda dapat memperbaiki profil sisi ke sisi kanan grafik
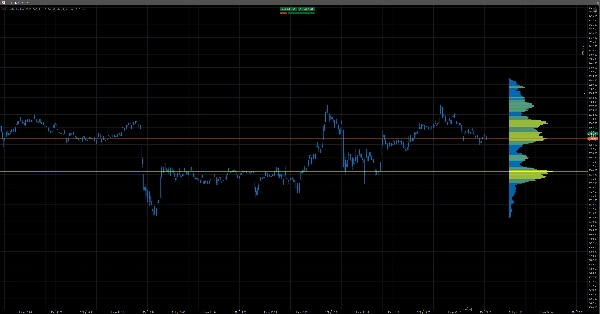
- Anda memiliki opsi untuk menampilkan profil sisi sebagai garis tunggal alih-alih bar
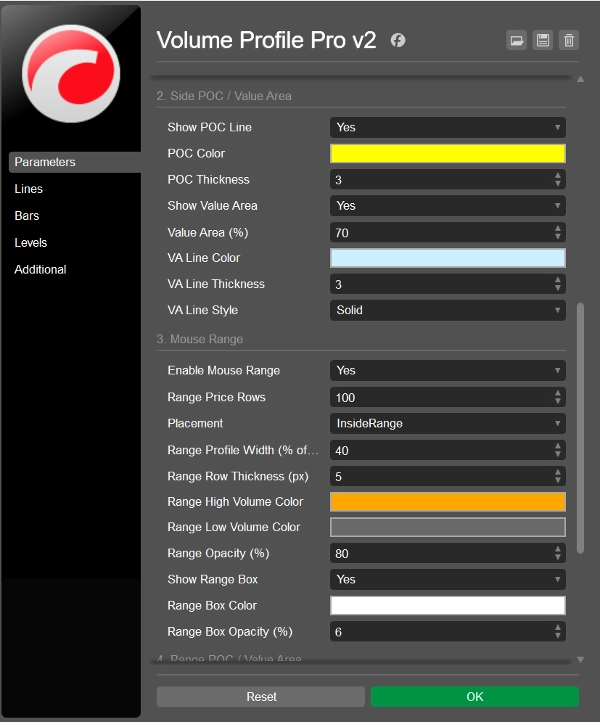
- Warna dan ketebalan POC
- Ambang persentase Nilai Area
- Gaya garis Nilai Area.
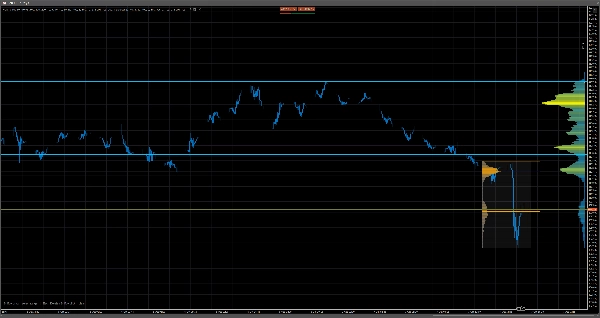
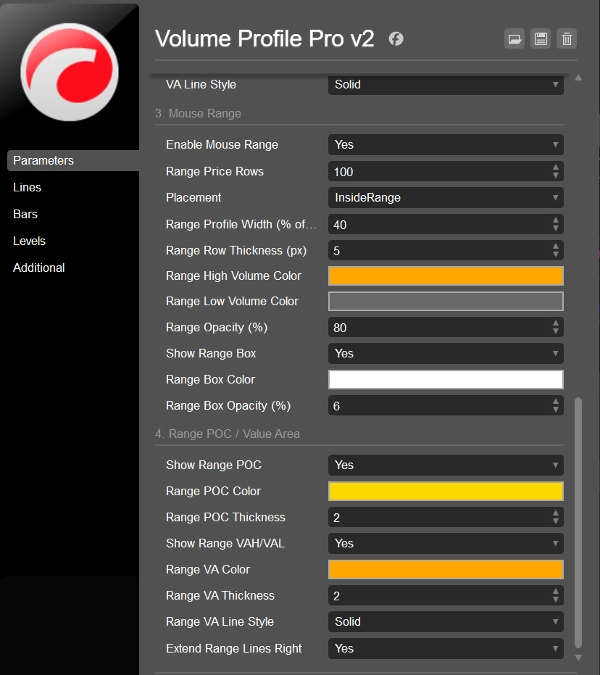
- Selain itu, sekarang Anda dapat menampilkan profil rentang dalam rentang yang dipilih. Cukup pilih crosshair, seret crosshair + tahan shift untuk memilih rentang dan tekan tombol Esc 2x untuk menghapus profil rentang.
Ini membuatnya sama berguna sebagai lapisan referensi latar belakang yang halus atau alat analitis mandiri yang mencolok.
Untuk siapa ini
- Trader yang menginginkan kombinasi indikator Volume Profile sisi & rentang yang ringan
- Trader yang menginginkan Volume Profile yang tampak bersih di mana Anda bahkan dapat menampilkan profil volume sebagai garis padat
- Trader yang ingin mengatur periode lookback pada grafik sendiri
- Trader yang ingin memiliki kemampuan untuk mengatur banyak warna dan opasitas
- Trader yang ingin menyesuaikan lebar dan penempatan pada grafik atau ingin memperbaikinya di sisi
- Trader yang ingin mengatur jumlah baris harga (disarankan untuk menjaga ini di bawah 400)
- Trader yang ingin mengaktifkan atau menonaktifkan garis Titik Kontrol (POC), Nilai Area Tinggi (VAH) dan Nilai Area Rendah (VAL) serta menyesuaikan tampilannya
Gabungkan ini dengan indikator Level 2 DOM Volume Delta Pro kami untuk keputusan yang lebih baik di level kunci: https://ctrader.com/products/4138
Lihat Bot Black Box kami yang luar biasa di sini: https://ctrader.com/products/3241
Ringkasan
The tool analyzes historical bar data by dividing the high-to-low price range into evenly spaced rows and distributing each bar’s tick volume across these rows. This creates a volume-at-price histogram with adjustable bar widths proportional to volume and a gradient color scheme indicating volume intensity. It operates solely on standard OHLCV bar data without requiring tick feeds or external sources, recalculating only on the latest bar to maintain performance.
Users can extensively customize visual and analytical settings, including lookback period, number of price rows, profile width, opacity, colors, and the appearance and visibility of POC, VAH, and VAL lines. This flexibility allows the indicator to serve as either a subtle background reference or a prominent analytical tool. It supports analysis of key market structure concepts such as supply and demand, support and resistance, and liquidity zones.
Ulasan pelanggan
5 | 33 % | |
4 | 67 % | |
3 | 0 % | |
2 | 0 % | |
1 | 0 % |