
Fractals
Indikator
2 pembelian
Versi 1.0, Aug 2025
Windows, Mac
4.0
Ulasan: 2
Penerangan
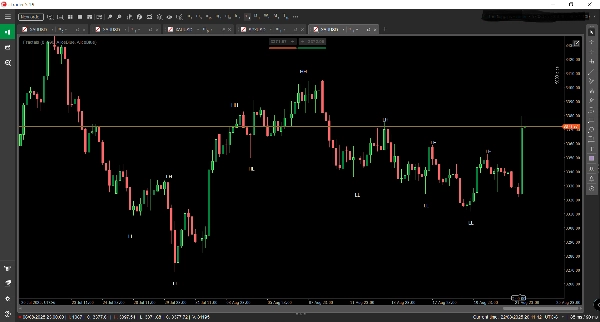
🧠 Fraktal – Struktur Pasaran Divisualisasikan
Fraktal adalah penunjuk dagangan yang direka dengan tepat untuk cTrader yang mendedahkan seni bina tersembunyi tindakan harga. Dengan mengesan dan melabel secara automatik Tinggi Lebih Tinggi (HH), Rendah Lebih Tinggi (HL), Tinggi Lebih Rendah (LH), dan Rendah Lebih Rendah (LL) terus pada carta, Fraktal mengubah data harga mentah menjadi peta struktur pasaran yang jelas dan boleh diambil tindakan.
🔍 Ciri Utama:
- Pemetaan Struktur Masa Nyata: Segera mengenal pasti titik ayunan dan melabelnya untuk mendedahkan arah aliran dan zon pembalikan.
- Kesedaran Pelbagai Jangka Masa: Direka untuk menyerlahkan struktur makro pada jangka masa yang lebih tinggi, memberikan pedagang kelebihan strategik dalam menyelaraskan kemasukan dengan aliran dominan.
- Pengoptimuman Mengikuti Aliran: Sesuai untuk pedagang yang menggunakan momentum, pecahan, atau strategi tarik balik, membantu mengesahkan bias dan mengelakkan perangkap bertentangan aliran.
- Lapisan Visual Bersih: Anotasi carta yang elegan yang berintegrasi dengan lancar dengan mana-mana susunan dagangan, meningkatkan kejelasan tanpa kekacauan.
🧭 Kes Penggunaan:
- Kenal pasti aliran yang muncul dan peralihan struktur sebelum ia menjadi jelas.
- Sahkan susunan dagangan dengan pengesahan struktur.
- Gabungkan dengan purata bergerak, volum, atau penunjuk tersuai untuk konfluens berlapis.
- Sesuai untuk ujian semula manual dan penilaian firma prop di mana logik berasaskan struktur adalah kunci.
Ringkasan
Ringkasan AI
Fractals is a trading indicator designed for the cTrader platform that visualizes market structure by automatically detecting and labeling key price action points: Higher Highs (HH), Higher Lows (HL), Lower Highs (LH), and Lower Lows (LL). It provides real-time mapping of swing points to reveal trend direction and potential reversal zones. The indicator supports multi-timeframe analysis, emphasizing macro structure on higher timeframes to help align trades with dominant market trends. Fractals is optimized for momentum, breakout, and pullback strategies, assisting traders in confirming bias and avoiding counter-trend trades. Its clean visual overlay integrates smoothly with existing chart setups, enhancing clarity without clutter. Use cases include spotting emerging trends and structural shifts early, validating trade setups with structural confirmation, combining with other indicators like moving averages or volume for layered analysis, and supporting manual backtesting and prop firm evaluations where market structure is critical. The indicator applies across various markets including Forex, indices, commodities, cryptocurrencies, and stocks.
Profil indikator
Ulasan pelanggan
4.0
Ulasan: 2
5 | 0 % | |
4 | 100 % | |
3 | 0 % | |
2 | 0 % | |
1 | 0 % |
Ulasan pelanggan
August 31, 2025
it gives the trade idea another check, but the result needs a journal.
August 27, 2025
Perbincangan
Soalan Lazim
Prop
Forex
Indices
Commodities
Crypto
Stocks
Produk yang tersedia melalui cTrader Store, termasuk bot dagangan, indikator dan plugin, disediakan oleh pembangun pihak ketiga dan diberikan akses untuk tujuan maklumat dan teknikal sahaja. cTrader Store bukan broker dan tidak memberikan nasihat pelaburan, syor peribadi atau sebarang jaminan prestasi masa hadapan.


![Logo "[Hamster-Coder] Moving Average MTF"](https://cdn.ctrader.com/image/webp/b11b98b1-194d-4b8e-b00e-d611826ad159_31226)

Harga
26
Jualan
2.18K
Pemasangan percuma