
Penerangan
📈 Penunjuk AutoFibRetracement
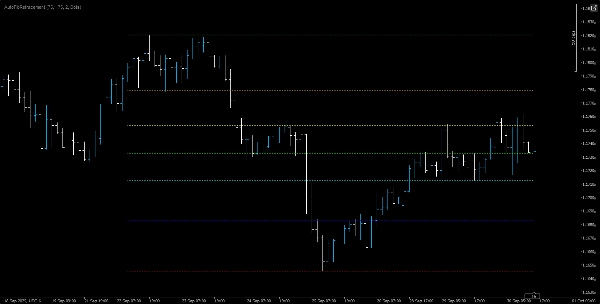
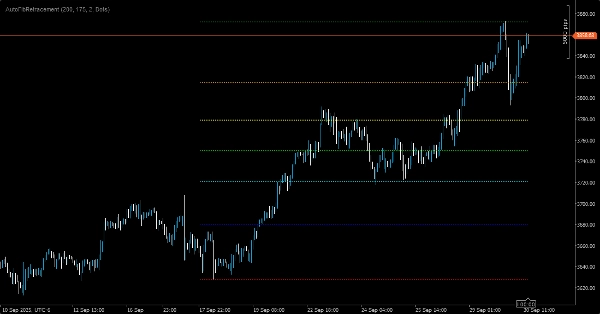
Penunjuk AutoFibRetracement adalah alat lapisan yang kuat yang direka untuk secara automatik melukis tahap retracement Fibonacci berdasarkan ayunan harga terkini. Sesuai untuk pedagang yang ingin mengenal pasti zon sokongan dan rintangan yang berpotensi, penunjuk ini mengira tahap retracement secara dinamik menggunakan parameter yang boleh disesuaikan dan memaparkannya terus pada carta.
🔧 Ciri Utama:
• Pengesanan Ayunan Automatik: Mengira ayunan tertinggi dan terendah dalam tetingkap tinjauan yang ditentukan pengguna.
• Tetingkap Tempoh Boleh Disesuaikan: Pedagang mesti memilih tetingkap yang sesuai untuk menangkap ayunan tertinggi dan terendah yang bermakna dengan tepat. Pilihan ini penting untuk menyelaraskan tahap retracement dengan struktur pasaran sebenar.
• Tahap Fibonacci: Termasuk nisbah standard — 0%, 23.6%, 38.2%, 50%, 61.8%, 78.6%, dan 100% — setiap satu berwarna untuk kejelasan visual.
• Pilihan Gaya Visual:
• Ketelusan boleh laras (0–255) untuk ketelusan garis.
• Ketebalan dan gaya garis yang boleh dikonfigurasikan (contohnya, bertitik, pepejal).
• Paparan Lapisan: Melukis terus pada carta harga untuk integrasi lancar dengan alat analisis teknikal lain.
🎯 Kes Penggunaan:
Sesuai untuk pedagang ayunan, pengikut tren, dan penganalisis teknikal yang bergantung pada zon retracement Fibonacci untuk merancang kemasukan, keluar, dan tahap stop-loss. Keberkesanan penunjuk ini bergantung pada keupayaan pedagang untuk memilih saiz tetingkap yang betul — terlalu pendek mungkin terlepas ayunan yang lebih luas, terlalu panjang mungkin melemahkan tindakan harga terkini.


