
Penerangan
Penunjuk Pecahan Volatiliti - Enjin Volatiliti Hawkes
Penunjuk ini bertujuan untuk memberikan konteks, bukan tindakan perdagangan segera. Komponen volatiliti membantu anda mengetahui bila keadaan pasaran berubah - tempoh volatiliti rendah sering mendahului pergerakan besar, dan tempoh volatiliti tinggi akhirnya akan habis. Komponen EWMA memastikan anda berorientasi dengan trend yang sedang berkembang dan menonjolkan bila harga menjauh daripadanya.
Gabungkan dua perspektif ini - rejim volatiliti dan konteks trend - dengan metodologi perdagangan dan pertimbangan anda sendiri. Penunjuk ini menunjukkan persekitaran - anda yang menentukan apa yang perlu dilakukan di dalamnya.
Versi 2.0
Terbuka untuk kemas kini masa depan
-----------------------------------------------------------------------------------------------------------------------------------------------------------------------
Gambaran Keseluruhan
-----------------------------------------------------------------------------------------------------------------------------------------------------------------------
Penunjuk ini menggabungkan dua komponen berbeza untuk membantu pedagang mengenal pasti rejim volatiliti dan keadaan trend secara serentak.
Komponen pertama menggunakan Proses Hawkes untuk mengesan perubahan dalam volatiliti pasaran. Berbeza dengan penunjuk volatiliti tradisional, ia tidak meramalkan arah—ia hanya memberi isyarat bila pasaran beralih dari pemampatan tenang ke volatiliti aktif, atau sebaliknya. Anggap ia sebagai pengesan keadaan volatiliti: ia memberitahu bila keadaan memanas atau menyejuk, tetapi tidak ke arah mana harga akan bergerak.
Komponen kedua menambah sistem EWMA berganda (Purata Pergerakan Berwajaran Eksponen) yang dipaparkan pada carta harga anda. Ini memberikan konteks trend menggunakan persilangan purata bergerak cepat dan perlahan, dengan lapisan tambahan pewarnaan lilin untuk menunjukkan bila harga menyimpang dari trend.
-----------------------------------------------------------------------------------------------------------------------------------------------------------------------
Bagaimana ia berfungsi
-----------------------------------------------------------------------------------------------------------------------------------------------------------------------
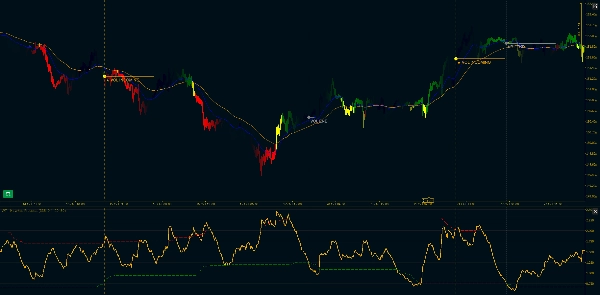
Pengesanan Volatiliti: Penunjuk menggunakan penganggar Volatiliti Tinggi-Rendah Parkinson—kaedah yang lebih cekap daripada ATR standard kerana ia menggunakan julat bar penuh. Volatiliti yang dinormalisasi ini dimasukkan ke dalam pengiraan Proses Hawkes, yang kemudian dibandingkan dengan ambang berasaskan kuantil dinamik.
Apabila volatiliti melepasi ambang atas selepas tempoh pemampatan, anda mendapat isyarat "VOL INCOMING". Apabila ia turun kembali di bawah ambang bawah, anda melihat "VOL END". Ini bukan isyarat masuk—ia adalah perubahan rejim volatiliti. Pasaran sama ada sedang bangun atau tidur.
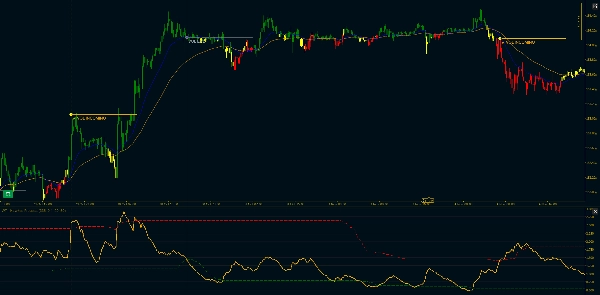
Konteks Trend: Dua purata bergerak berwajaran eksponen (Cepat dan Perlahan) muncul pada carta utama anda. MA Cepat berwarna biru, MA Perlahan berwarna oren. Apabila Cepat berada di atas Perlahan, trend menaik. Apabila Cepat berada di bawah Perlahan, trend menurun.
Penapis Penyimpangan: Di sinilah ia menjadi menarik. Kadang-kadang harga menjauh dengan ketara dari trend. Apabila keseluruhan lilin (buka, tinggi, rendah, tutup) berada di bawah MA Cepat semasa trend menaik, atau di atasnya semasa trend menurun, bar menjadi kuning. Ini adalah penapis ketat—jika walaupun sumbu menyentuh MA Cepat, ia kekal dengan warna trend biasa.
Bar kuning sering muncul pada retracement atau titik keletihan, tetapi ingat: ia tidak memberitahu apa yang akan datang seterusnya, hanya bahawa harga telah berpisah sementara dari garis trend.
-----------------------------------------------------------------------------------------------------------------------------------------------------------------------
Ciri-ciri Utama
-----------------------------------------------------------------------------------------------------------------------------------------------------------------------
Komponen Volatiliti:
- Penormalan Volatiliti Tinggi-Rendah Parkinson (lebih cekap daripada kaedah ATR standard)
- Pengiraan Proses Hawkes dengan peluruhan boleh laras (parameter Kappa)
- Ambang berasaskan kuantil dinamik (peratusan boleh disesuaikan)
- Penanda visual: "VOL INCOMING" pada pecahan volatiliti, "VOL END" pada pemampatan
- Penapisan sambungan: hanya pecahan pertama ditandakan, bukan setiap lonjakan
- Garis trend mendatar pilihan dan penanda menegak
Komponen Trend EWMA:
- Pengiraan EWMA serasi Pandas (formula adjust=True)
- Garis MA Cepat dan Perlahan dipaparkan pada carta harga utama
- Panjang span boleh disesuaikan (default: 20/50)
- Sokongan tempoh minimum (menyekat output sehingga data mencukupi)
- Pilihan abaikan NA untuk mengendalikan jurang
- Sistem lilin tiga warna: Hijau (trend menaik), Merah (trend menurun), Kuning (penyimpangan)
Pilihan Penyesuaian:
- Tempoh Parkinson (tempoh semakan untuk pengiraan volatiliti)
- Hawkes Kappa (kadar peluruhan, mempengaruhi kepekaan)
- Tempoh Semakan Kuantil
- Ambang Volatiliti Rendah dan Tinggi (peratusan)
- Togol annualisasi dan panjang segmen
- Span Cepat dan Perlahan untuk purata bergerak
- Warna Bullish, Bearish, dan Penyimpangan
- Panjang lanjutan garis trend
- Tunjuk/sembunyi penanda menegak
----------------------------------------------------------------------------------------------------------------------------------------------------------------------------
Nota Teknikal: Komponen Proses Hawkes menggunakan pengiraan eksponen rekursif yang dioptimumkan untuk penggunaan masa nyata. Pelaksanaan EWMA sepadan dengan tingkah laku Pandas untuk konsistensi dengan ujian semula berasaskan Python. Kedua-dua komponen hanya mengira pada bar yang ditutup untuk mengelakkan pengecatan semula.
Ringkasan
Ulasan pelanggan
5 | 100 % | |
4 | 0 % | |
3 | 0 % | |
2 | 0 % | |
1 | 0 % |


