
Ariaware.003PGap
อินดิเคเตอร์
73 ดาวน์โหลด
เวอร์ชัน 1.1, Jul 2026
Windows, Mac
5.0
รีวิว: 1
คำอธิบาย
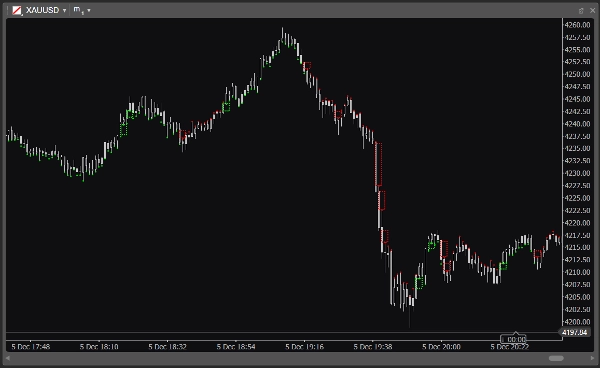
ตัวบ่งชี้ช่องว่างของราคา
The Pressure Gap Indicator ระบุการเคลื่อนที่ของราคาที่เกิดขึ้นอย่างกะทันหันและระดับราคาที่พลาดโดยไม่ต้องพึ่งพาข้อมูลปริมาณ ช่องว่างเหล่านี้เกิดขึ้นเมื่อตลาดเคลื่อนไหวอย่างรุนแรง ทำให้เทรดเดอร์บางรายพลาดราคาที่ต้องการเข้าออกตลาด
ราคามักจะกลับไปยังพื้นที่ที่ยังไม่ได้เติมเต็มเหล่านี้ก่อนที่จะดำเนินต่อไปในทิศทางเดียวกัน ตัวบ่งชี้นี้เน้นโซนแรงกดดันเหล่านี้ ช่วยให้เทรดเดอร์ระบุการดึงกลับที่เป็นไปได้และโอกาสในการเข้าเทรดที่มีความเสี่ยงต่ำซึ่งสอดคล้องกับแนวโน้มตลาด
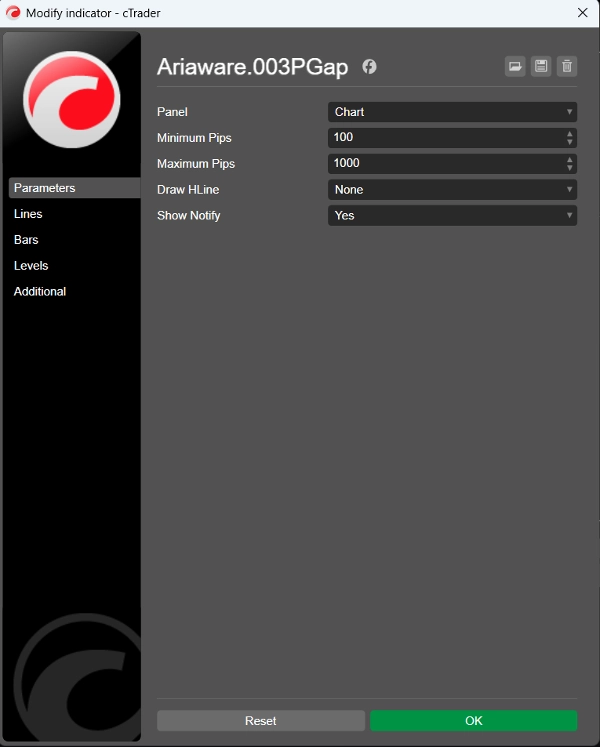
คุณสมบัติหลัก:
- ตรวจจับ Fair Value Gaps (FVG) และ Breakaway Gaps (BAG).
- อนุญาตให้กรองและแสดงเฉพาะ FVG, เฉพาะ BAG หรือทั้งสองพร้อมกัน
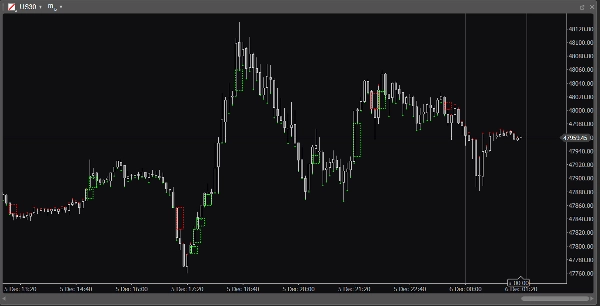
- แสดงภาพที่ชัดเจนของช่องว่างราคาที่สำคัญและโซนที่อาจเกิดปฏิกิริยา
- ช่วยเทรดเดอร์วิเคราะห์โครงสร้างตลาดและระบุโอกาสในการดำเนินแนวโน้มต่อไป
สรุป
สรุปโดย AI
The Ariaware.003PGap is a Pressure Gap indicator designed to identify sudden price jumps and unfilled price levels without relying on volume data. It detects two types of gaps: Fair Value Gaps (FVG) and Breakaway Gaps (BAG), which occur during aggressive market moves that cause missed entry or exit prices for some traders. The indicator visually highlights these pressure zones, which price often revisits before continuing in the original direction. This feature helps traders identify potential pullbacks and lower-risk entry points aligned with the prevailing market trend. Users can filter the display to show only FVG, only BAG, or both simultaneously, facilitating detailed market structure analysis and trend continuation assessment.
โปรไฟล์อินดิเคเตอร์
รีวิวจากลูกค้า
5.0
รีวิว: 1
5 | 100 % | |
4 | 0 % | |
3 | 0 % | |
2 | 0 % | |
1 | 0 % |
รีวิวจากลูกค้า
December 10, 2025
Ariaware.003PGap marks micro-gaps and price discontinuities. Useful for spotting imbalance zones and liquidity voids. Works well across instruments but can get noisy on lower TFs. Great as an SMC/ICT supplementary tool, not a standalone entry trigger.
การสนทนา
คำถามที่พบบ่อย
Fair Value Gap
ผลิตภัณฑ์ที่มีให้บริการผ่าน cTrader Store รวมถึงบอทการเทรด อินดิเคเตอร์ และปลั๊กอิน มีให้บริการโดยนักพัฒนาบุคคลที่สามและมีไว้เพื่อวัตถุประสงค์ในการเข้าถึงข้อมูลและทางเทคนิคเท่านั้น cTrader Store ไม่ใช่โบรกเกอร์และไม่ได้ให้คำแนะนำการลงทุน คำแนะนำส่วนบุคคล หรือการรับประกันผลการดำเนินงานในอนาคต
เพิ่มเติมจากผู้เขียนคนนี้


ราคา
246
ติดตั้งฟรี