
คำอธิบาย
แนะนำตัวชี้วัด True Strength Index (TSI) เครื่องมือทรงพลังที่ออกแบบมาเพื่อเพิ่มประสิทธิภาพกลยุทธ์การเทรดของคุณโดยให้ข้อมูลเชิงลึกที่ชัดเจนเกี่ยวกับโมเมนตัมของตลาดและความแข็งแกร่งของแนวโน้ม
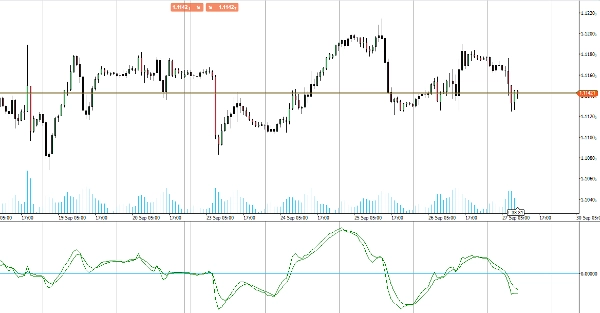
ตัวชี้วัด TSI วัดความแข็งแกร่งพื้นฐานของการเคลื่อนไหวของราคา ช่วยลดเสียงรบกวนในตลาดเพื่อให้คุณเห็นภาพทิศทางแนวโน้มที่แม่นยำยิ่งขึ้น โดยการเน้นสภาวะที่ซื้อมากเกินไปและขายมากเกินไป TSI ช่วยให้คุณระบุจุดกลับตัวที่เป็นไปได้และยืนยันการดำเนินต่อของแนวโน้ม
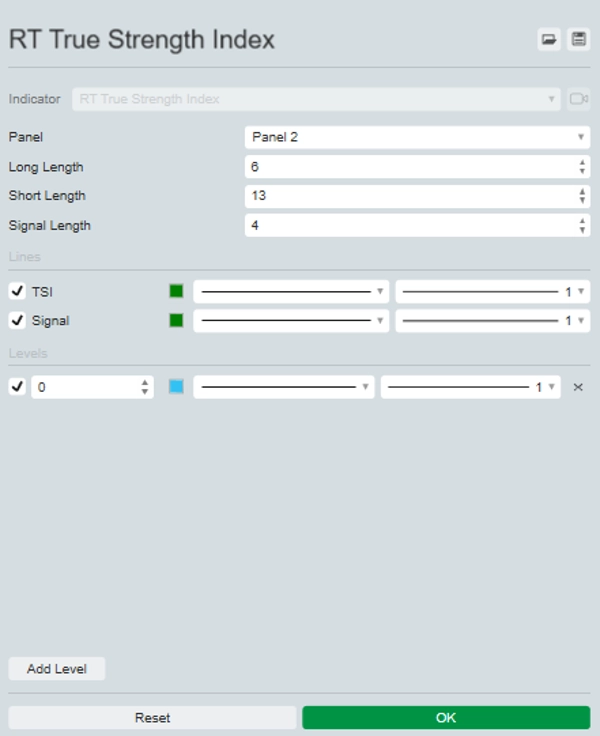
TSI ใช้ ค่าเฉลี่ยเคลื่อนที่ ของ โมเมนตัม พื้นฐานของเครื่องมือทางการเงิน โมเมนตัมถือเป็น ตัวชี้วัดนำ ของการเคลื่อนไหวของราคา และค่าเฉลี่ยเคลื่อนที่โดยทั่วไปจะตามหลังราคา TSI รวมลักษณะเหล่านี้เพื่อสร้างสัญญาณของราคาและทิศทางที่สอดคล้องกับการเปลี่ยนแปลงของตลาดมากกว่าทั้งโมเมนตัมหรือค่าเฉลี่ยเคลื่อนที่
เหมาะสำหรับเทรดเดอร์ที่ต้องการปรับปรุงการวิเคราะห์และการตัดสินใจ ตัวชี้วัด TSI มอบวิธีที่เชื่อถือได้และเข้าใจง่ายในการวัดพลวัตของตลาด อัปเกรดชุดเครื่องมือการเทรดของคุณด้วย True Strength Index เพื่อประสิทธิภาพการเทรดที่เหนือกว่า


