
คำอธิบาย
ตัวบ่งชี้แนวรับและแนวต้านหลายกรอบเวลามักช่วยให้นักเทรดเห็นภาพระดับเหล่านี้ในกรอบเวลาต่างๆ เช่น แผนภูมิรายชั่วโมง รายวัน รายสัปดาห์ หรือรายเดือน โดยการรวมหลายกรอบเวลา นักเทรดจะได้รับมุมมองที่กว้างขึ้นเกี่ยวกับตำแหน่งของระดับราคาสำคัญและวิธีที่ระดับเหล่านั้นอาจมีผลต่อการเคลื่อนไหวของราคา
ตัวบ่งชี้ประเภทนี้สามารถช่วยให้นักเทรดตัดสินใจซื้อขายได้อย่างมีข้อมูลมากขึ้นโดยการระบุระดับแนวรับและแนวต้านที่สำคัญซึ่งอาจส่งผลต่อการเคลื่อนไหวของราคาในกรอบเวลาต่างๆ นอกจากนี้ยังช่วยให้นักเทรดคาดการณ์การกลับตัวหรือโอกาสในการเบรคเอาท์เมื่อราคามาใกล้ระดับเหล่านี้ในหลายกรอบเวลา
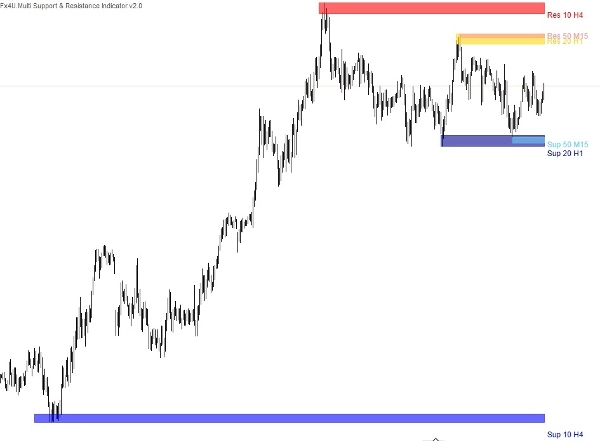
มีสามประเภทของระดับแนวรับ & แนวต้าน:
ตัวบ่งชี้แนวรับและแนวต้านทั้งสามถูกสร้างไว้ในตัวบ่งชี้เดียวนี้ ทำให้คุณสามารถวางโซนอุปทานและอุปสงค์บนแผนภูมิด้วยการตั้งค่าดังต่อไปนี้
- ค่าระยะเวลา
- กรอบเวลา
- จำนวนจุดสูงสุด – นี่คือจำนวนจุดแนวรับ/แนวต้านปัจจุบันและในอดีตที่แสดง ตัวอย่างเช่น หากเราเลือก 2 ตัวบ่งชี้จะเลือกจุดแนวรับและแนวต้านอีกจุดหนึ่งในอดีต
- ชื่อและสีของตัวบ่งชี้
ระดับแนวรับและแนวต้านที่สำคัญในกรอบเวลาที่สูงกว่ามักมีน้ำหนักมากกว่า และโดยการใช้ตัวบ่งชี้หลายกรอบเวลา นักเทรดสามารถยืนยันความสำคัญของระดับนั้นได้หากมันปรากฏอย่างสม่ำเสมอในหลายกรอบเวลา การยืนยันนี้ช่วยเพิ่มความน่าเชื่อถือของระดับและเสริมความมั่นใจให้นักเทรดในการตัดสินใจซื้อขาย
ผลิตภัณฑ์อื่นๆ ของฉัน:
https://ctrader.com/products/346
https://ctrader.com/products/336
https://ctrader.com/products/343
https://ctrader.com/products/347
https://ctrader.com/products/147
สรุป
The indicator consolidates three types of support and resistance levels into a single tool, allowing users to plot supply and demand zones with customizable settings such as period value, timeframe, the number of extremum points (current plus past support/resistance points), and indicator name and color. This multi-timeframe approach helps traders identify levels that carry more weight when confirmed across different timeframes, enhancing the reliability of these levels for decision-making.
By visualizing these critical zones, the indicator aids in anticipating potential price reversals or breakout opportunities. It supports a broader market overview, enabling more informed trading strategies based on the interaction of price with established support and resistance across various time horizons.
รีวิวจากลูกค้า
5 | 33 % | |
4 | 67 % | |
3 | 0 % | |
2 | 0 % | |
1 | 0 % |
!["[Fx4U] GBPUSD - Price Action" โลโก้](https://cdn.ctrader.com/image/webp/d80b34fc-da3c-4f01-a321-456450665649_26190)

!["[Fx4U] CADJPY - Price Action" โลโก้](https://cdn.ctrader.com/image/webp/1ba81247-b6b7-4f3c-a297-fa3eb1d57fe1_26195)

!["[Fx4U] AUDCHF - Price Action" โลโก้](https://cdn.ctrader.com/image/webp/0a22e9aa-c83b-42cd-b0b8-c1a2da593207_26148)

!["[Fx4U] EURAUD - Price Action" โลโก้](https://cdn.ctrader.com/image/webp/baf8dde4-1ef3-4beb-8ae2-0fed8320f65d_26177)


