
Multiple Non-Linear Regression
インジケーター
1 購入済
バージョン 1.0、Dec 2025
Windows、Mac
5.0
レビュー: 1
説明
このインジケーターは、終値、始値、高値、安値の4つの独立変数を使用して複数の非線形回帰分析を行うように設計されています。
以下はコンポーネントと機能です:
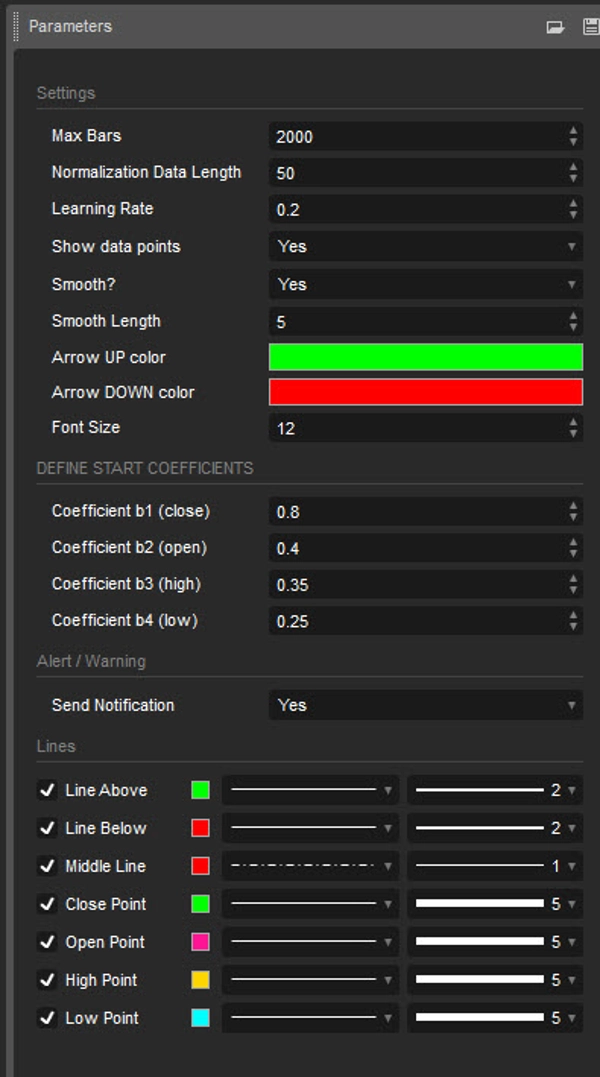
入力:
- 正規化データ長:正規化に使用されるデータの長さ。
- 学習率:アルゴリズムが誤差から学習する速度。
- データポイントの表示:正規化された入力データ(終値、始値、高値、安値)のプロットを表示。
- スムーズ化?:出力をスムーズ化するオプション。
- スムーズ長:スムーズ化が有効な場合のスムーズの長さ。
- 開始係数の定義:回帰方程式の初期係数。
データ正規化:
スクリプトは、指定された長さ内の最高値と最低値を使用して、入力データを0から1の範囲に正規化します。
非線形回帰:
入力された係数と正規化されたデータを使用して回帰方程式を計算します。使用される方程式は独立変数の加重和であり、係数は誤差を最小化するために勾配降下法で反復的に調整されます。
誤差計算:
スクリプトは実際の値と予測値の誤差を計算します。
勾配降下法:
誤差を最小化するために、係数は勾配降下法を用いて反復的に更新されます。
可視化:
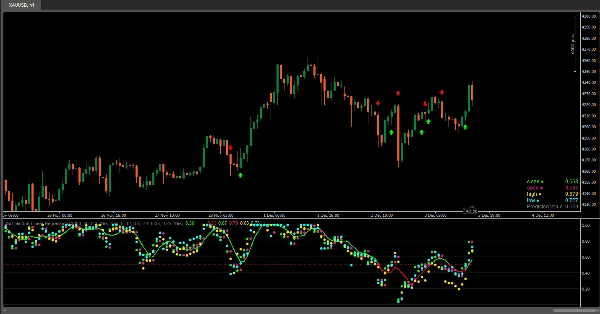
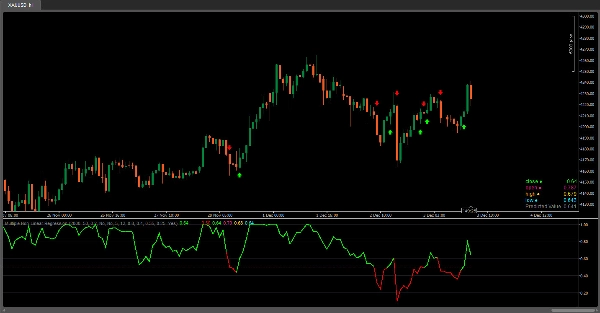
- 正規化された入力データ(終値、始値、高値、安値)のプロット。
- インジケーターは、チャート上に円形マーカーの形で正規化されたデータ値(終値、始値、高値、安値)を表示し、ユーザーがこれらの値の相対的な位置と回帰線との関係を容易に観察できるようにします。
- 回帰線のプロット。
- 回帰線の値とバーの色に基づくカラ―グラデーション。
- 正規化された入力データと予測値のテーブル表示。
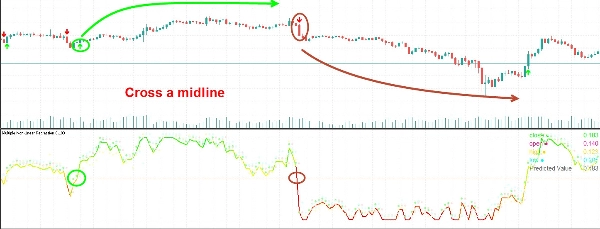
- 中間線(0.5)とのクロスオーバーのシグナル。
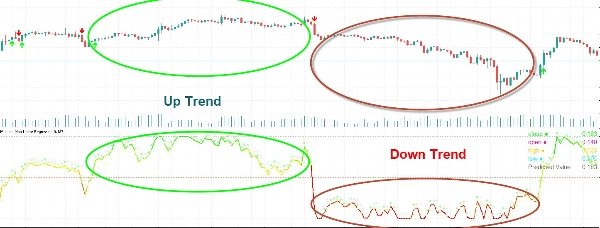
解釈:
ユーザーは回帰線と中間線(0.5)とのクロスオーバーを、買いまたは売りの潜在的なシグナルとして解釈できます。
このインジケーターは、複数の変数間の関係を分析し、回帰分析に基づいて取引判断を行うのに役立ちます。係数やパラメーターを調整することで、特定の市場状況に応じてモデルの性能を微調整できます。
概要
インジケーターのプロフィール
カスタマーレビュー
5.0
レビュー: 1
5 | 100 % | |
4 | 0 % | |
3 | 0 % | |
2 | 0 % | |
1 | 0 % |
カスタマーレビュー
ディスカッション
よくあるご質問
BTCUSD
Forex
Signal
Crypto
XAUUSD
NAS100
cTrader Storeで入手可能な取引ボット、インジケーター、プラグインなどの商品は、第三者の開発者が提供するものであり、情報と技術の取得のみを目的としてご利用いただけます。cTrader Storeはブローカーではなく、投資助言や個人的な推奨を行うことも、将来のパフォーマンスを保証することもありません。
この作成者の他の商品


価格
38
販売
2.39K
無料インストール