
VolumeColorBar
インジケーター
10 購入済
バージョン 1.2、Apr 2026
Windows、Mac
4.3
レビュー: 3
説明
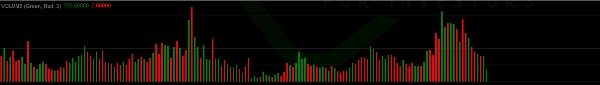
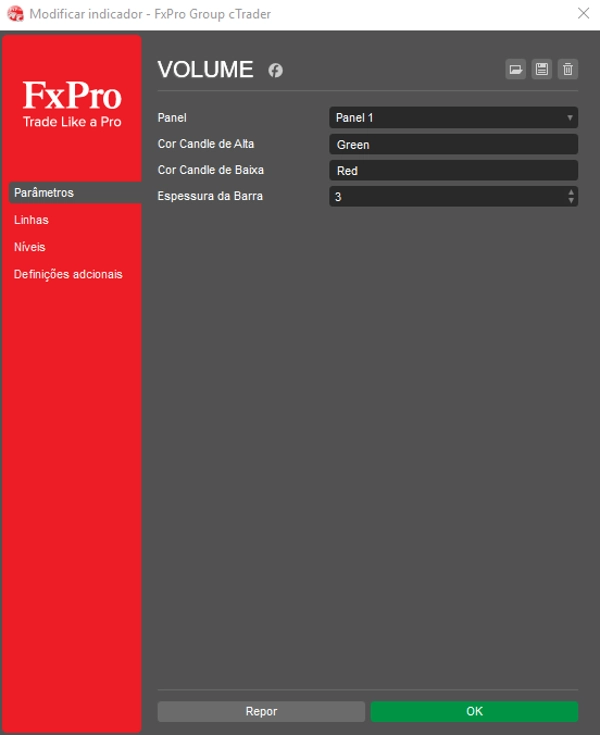
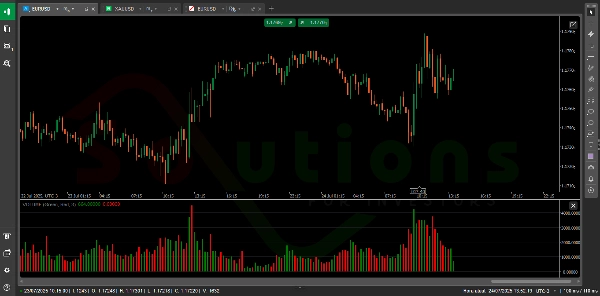
VolumeColorBar は、ローソク足の方向に基づいて色分けされたバーを使用して市場の出来高を視覚的に表現する強力なツールです。緑のバーは強気のローソク足(買い圧力)での出来高を示し、赤のバーは弱気のローソク足(売り圧力)での出来高を反映します。これにより、トレーダーは市場活動が買い手によって主に動かされているのか売り手によって動かされているのかを瞬時に評価でき、ブレイクアウトの確認、反転の特定、そしてより自信を持った取引タイミングの改善に役立ちます。
概要
AIによる概要
VolumeColorBar is a trading indicator that visualizes market volume using color-coded bars aligned with candle direction. It displays green bars for volume on bullish candles, indicating buying pressure, and red bars for volume on bearish candles, indicating selling pressure. This visual representation helps traders quickly assess whether market activity is dominated by buyers or sellers. The indicator supports various markets and symbols, including Forex pairs (EURUSD, GBPUSD, NZDUSD, USDJPY), cryptocurrencies (BTCUSD, crypto), commodities (XAUUSD, gold, oil, silver), indices (NAS100, SP500, DAX, Dow), and stocks. By providing immediate insight into volume dynamics relative to price movement, VolumeColorBar aids in confirming breakouts, identifying potential reversals, and improving trade timing decisions.
インジケーターのプロフィール
カスタマーレビュー
4.3
レビュー: 3
5 | 33 % | |
4 | 67 % | |
3 | 0 % | |
2 | 0 % | |
1 | 0 % |
カスタマーレビュー
April 14, 2025
Clean tool for workflow for a more controlled workflow. It helps with planning entries around the first range, but false breaks still need filtering. I would track 20 market opens, the first 30 to 60 minutes and a target near 1.5R. I would still keep manual review in the process.
April 13, 2025
April 13, 2025
Worth a closer look around opening range breakouts. The useful part is planning entries around the first range, with the numbers checked before scaling. The setup should be tested across at least 15 sessions because 2 or 3 fakeouts can change the picture. The trade idea is clear, but it needs a hard stop and a defined breakout rule.
ディスカッション
よくあるご質問
BTCUSD
Forex
Signal
Breakout
Indices
EURUSD
Commodities
GBPUSD
NZDUSD
Prop
Crypto
Stocks
XAUUSD
NAS100
USDJPY
cTrader Storeで入手可能な取引ボット、インジケーター、プラグインなどの商品は、第三者の開発者が提供するものであり、情報と技術の取得のみを目的としてご利用いただけます。cTrader Storeはブローカーではなく、投資助言や個人的な推奨を行うことも、将来のパフォーマンスを保証することもありません。
この作成者の他の商品


これも好きかも


価格
登録日 05/02/2025
31
販売