
説明
カスタムRSI – 精度とクリーンなビジュアルでスポットリバーサルを実現
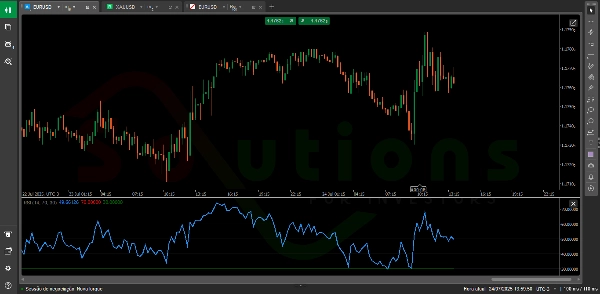
カスタムRSIは、トレーダーが迅速に相対力指数(RSI)のクラシックなバージョンを強化したもので、買われ過ぎおよび売られ過ぎゾーン—価格が反転しやすい重要なエリアを特定するのに役立ちます。
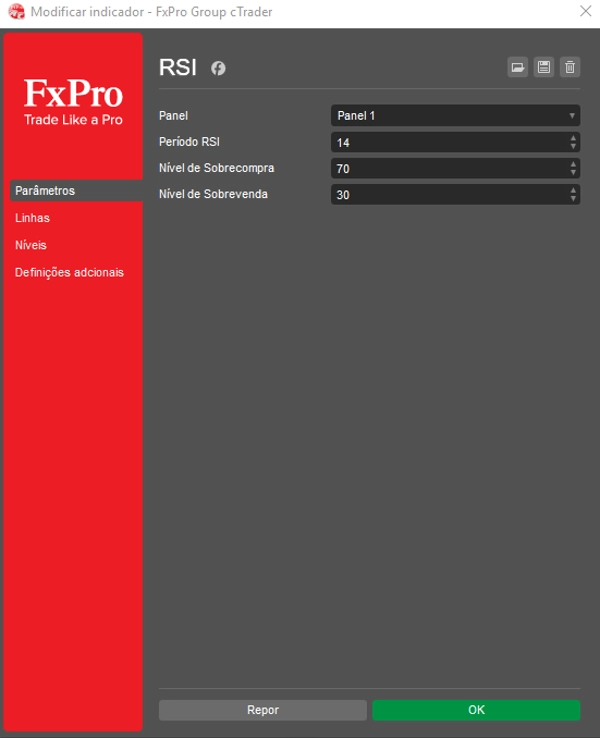
クリーンで直感的なインターフェースにより、従来の70および30レベルのような完全にカスタマイズ可能な水平線を2本表示し、チャート上の高確率の意思決定ポイントを明確に示します。
✅ トレードスタイルに合わせて時間枠とRSIレベルを調整
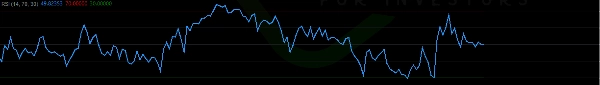
✅ より自信を持って潜在的な反転ゾーンを特定
✅ 明確で煩雑さのないインジケーターでテクニカル分析を強化
あらゆるレベルのトレーダーに最適なカスタムRSIは、生の価格データをスマートで実用的な洞察に変換し、利益を上げる意思決定に不可欠なツールとなります。
概要
AIによる概要
Custom RSI is a technical indicator based on the classic Relative Strength Index (RSI) designed to identify overbought and oversold market zones. It calculates price movement strength using candlestick closing prices and displays two customizable horizontal lines, typically set at levels like 70 and 30, to mark critical decision points. Users can adjust the timeframe and RSI levels to suit their trading style, facilitating the identification of potential reversal zones. The indicator offers a clean, uncluttered visual interface that supports enhanced technical analysis across various markets including Forex, stocks, commodities, indices, and cryptocurrencies. Custom RSI is suitable for traders aiming to improve decision-making by highlighting high-probability reversal areas on their charts.
インジケーターのプロフィール
カスタマーレビュー
4.0
レビュー: 3
5 | 0 % | |
4 | 100 % | |
3 | 0 % | |
2 | 0 % | |
1 | 0 % |
カスタマーレビュー
April 25, 2025
the workflow feels calmer, but it needs a few bad trades in the sample too.
April 20, 2025
April 12, 2025
the first reaction should not be the whole decision, but human context still matters here.
ディスカッション
よくあるご質問
BTCUSD
Forex
Signal
Indices
EURUSD
Commodities
GBPUSD
NZDUSD
RSI
Prop
Scalping
Crypto
Stocks
XAUUSD
NAS100
USDJPY
cTrader Storeで入手可能な取引ボット、インジケーター、プラグインなどの商品は、第三者の開発者が提供するものであり、情報と技術の取得のみを目的としてご利用いただけます。cTrader Storeはブローカーではなく、投資助言や個人的な推奨を行うことも、将来のパフォーマンスを保証することもありません。
この作成者の他の商品


![「[Hamster-Coder] Pivot Points MTF」ロゴ](https://cdn.ctrader.com/image/webp/4c143e5a-309c-40e3-a578-f04d1e133ffa_31159)


価格
登録日 05/02/2025
30
販売