

Açıklama
SABİT ARALIK HACİM PROFİLİ (FRVP)
Otomatik Algılama Hacim Profili Göstergesi
--------------------------------------------------
Hacim dağılımı. Değer alanları. Yüksek hacimli düğümler. Hepsi trend çizginizden.
--------------------------------------------------
BU GÖSTERGE NE YAPAR
Sabit Aralık Hacim Profili (FRVP), kullanıcı tarafından tanımlanan bir aralıkta hacim dağılımını gösterir — çizdiğiniz en son trend çizgisini otomatik olarak algılar.
Manuel aralık seçimine gerek yok. Sadece bir trend çizgisi çizin ve profil görünür.
--------------------------------------------------
ANA ÖZELLİKLER
- En son trend çizgisini otomatik algılar (manuel isimlendirme gerekmez)
- Kontrol Noktası (POC) - en yüksek hacim seviyesi
- Değer Alanı (VAH + VAL) - yapılandırılabilir yüzde (varsayılan %70)
- Yüksek Hacimli Düğümler (HVN) - ortalama eşik üzerindeki hacim
- Histogram gösterimi (aralığın solunda veya sağında)
- Yapılandırılabilir satırlar (10 ila 200)
- Özelleştirilebilir renkler ve opaklık
- Çizgileri sağa uzat
- Fiyat etiketlerini göster/gizle
- Yeniden boyama yok
--------------------------------------------------
NASIL ÇALIŞIR
1. Grafikte bir trend çizgisi çizin
2. Gösterge bunu otomatik olarak algılar
3. Hacim profili aralıktan hesaplanır
4. POC, VAH, VAL ve HVN gösterilir
İsimlendirme gerekmez. Manuel aralık seçimi yoktur.
--------------------------------------------------
GÖRSEL ÖGELER
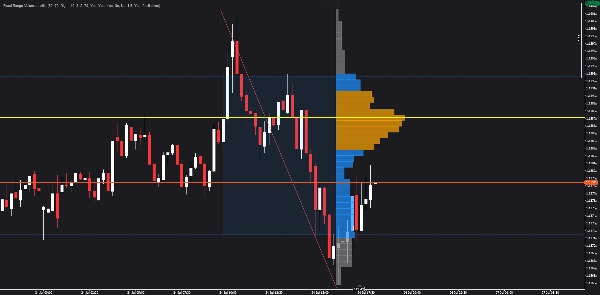
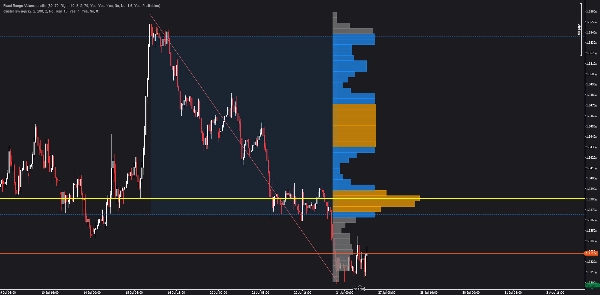
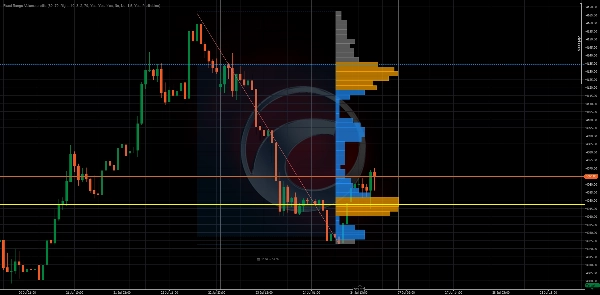
- Sarı yatay çizgi = Kontrol Noktası (POC)
- Mavi kesikli çizgiler = Değer Alanı Yüksek (VAH) ve Değer Alanı Düşük (VAL)
- Turuncu çubuklar = Yüksek Hacimli Düğümler (HVN)
- Gri çubuklar = Düşük hacimli düğümler
- Gölgelendirilmiş bölge = Değer Alanı (hacmin %70'i)
- Histogram = Fiyat seviyesine göre hacim dağılımı
--------------------------------------------------
PARAMETRE GENEL BAKIŞ
PROFİL AYARLARI:
- Satır Sayısı: Kaç fiyat satırı (10-200)
- Değer Alanı Yüzdesi: Değer alanındaki hacim yüzdesi (1-100)
GÖRSEL AYARLAR:
- Profil Tarafı: Aralığın Solu veya Sağı
- Histogram Genişliği %: Histogram çubuklarının genişliği
- Çubuk Genişliği Ölçeklendirme: Çubuk genişlikleri için ölçek faktörü
- Min Çubuk Genişliği %: Minimum çubuk genişliği
- Çubuk Opaklığı: Çubukların saydamlığı (10-100)
RENKLER:
- POC Rengi
- Değer Alanı Rengi
- Yüksek Hacimli Düğüm Rengi
- Düşük Hacim Rengi
YÜKSEK HACİMLİ DÜĞÜMLER:
- HVN Eşiği: HVN olarak nitelendirmek için hacim çarpanı
TREND ÇİZGİSİ AYARLARI:
- En Sonu Otomatik Algıla: En son trend çizgisini otomatik bul
- Manuel Trend Çizgisi Adı: Bir isim belirtin (otomatik algılama kapalıysa)
--------------------------------------------------
KULLANIM ALANLARI
- En çok hacmin nerede gerçekleştiğini belirleyin
- Giriş/çıkışlar için Kontrol Noktasını (POC) bulun
- Kar hedefleri için Değer Alanını (VAH/VAL) kullanın
- Ana seviyeler için Yüksek Hacimli Düğümleri (HVN) tespit edin
- Hacim dağılımını hızlıca anlayın
- Diğer göstergelerle birlikte kullanarak uyumu artırın
--------------------------------------------------
YAPISAL ISI BÖLGELERİNE YÜKSELTİN
Bu gösterge size hacim dağılımını gösterir.
Yapısal Isı Bölgeleri daha ileri gider — katılım yoğunluğunu, kabul ve reddi, ve piyasa etkileşimini birden fazla bölgede haritalar.
Yapısal Isı Bölgeleri için cTrader Mağazasında arama yapın.
--------------------------------------------------
INVICTUS EA'YA YÜKSELTİN
Invictus EA, otomatik işlemler yapmak için yapısal teknolojiyi kullanır.
Invictus için cTrader Mağazasında arama yapın.
--------------------------------------------------
TEKNİK NOTLAR
- Üst üste binen gösterge
- Her zaman diliminde ve sembolde çalışır
- Yeniden boyama yok (tarihsel hesaplama)
- Performans için optimize edilmiştir
--------------------------------------------------
DESTEK
Ömür boyu güncellemeler dahildir.
DAHA FAZLA BİLGİ İÇİN - Aşağıdaki Geliştirici Profili'ne tıklayın.





























