
Description
ZONES DE CHALEUR STRUCTURELLES
Carte d'Intensité de Participation
--------------------------------------------------
Voyez où le prix lutte. Voyez où il ignore.
La plupart des outils de support/résistance tracent des lignes là où le prix ÉTAIT.
Les Zones de Chaleur Structurelles répondent : Le marché se SOUCIE-t-il réellement de ce niveau ?
--------------------------------------------------
ÉVALUATION DE L'INTENSITÉ DE CHALEUR (0 à 100)
L'indicateur analyse le regroupement des oscillations et attribue un score de chaleur :
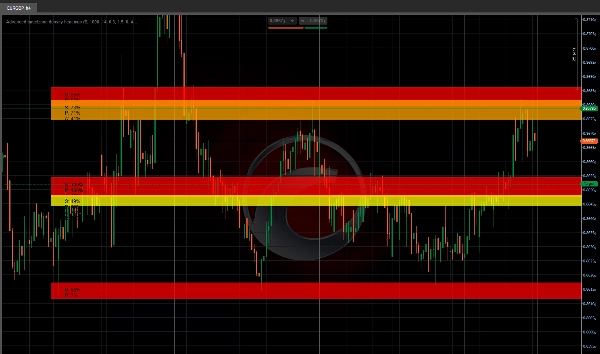
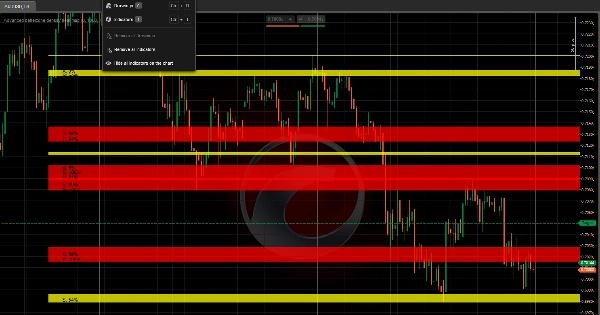
- Zones rouges (chaleur de 80 à 100) = Participation structurelle la plus forte
- Zones orange (chaleur de 60 à 80) = Zone structurelle active
- Zones jaunes (chaleur de 40 à 60) = Intérêt modéré
- Zones bleues (chaleur inférieure à 40) = Structure faible
Chaleur plus élevée = plus d'oscillations regroupées = plus d'attention du marché.
--------------------------------------------------
SUIVI DE L'ACCEPTATION VS REJET
Pour chaque zone de chaleur structurelle, l'indicateur suit le comportement du prix :
- ACCEPTATION = Le prix clôture à l'intérieur de la zone (comportement de support)
- REJET = Le prix laisse de longues mèches à la zone (comportement de résistance)
Cela vous indique si une zone est susceptible de TENIR ou de SE RENVER.
--------------------------------------------------
ANALYSE DE L'ENGAGEMENT DU MARCHÉ
Le système mesure :
- Touches de chandelles (fréquence des visites du prix dans chaque zone)
- Clôtures à l'intérieur (taux d'acceptation)
- Rejets par mèches (taux de rejet)
- Période de retour configurable
Faible engagement = zone faible. Fort engagement = zone de chaleur structurelle.
--------------------------------------------------
CARTOGRAPHIE VISUELLE DE L'INTENSITÉ
- Zones codées par couleur selon le score de chaleur (rouge = le plus chaud)
- Extensions en halo pour visualiser les rejets
- Étiquettes de données affichant : Chaleur / Participation / Acceptation / Rejet
- Nettoyage automatique (les zones se redessinent automatiquement)
- Flèches optionnelles pour les hauts/bas des oscillations
--------------------------------------------------
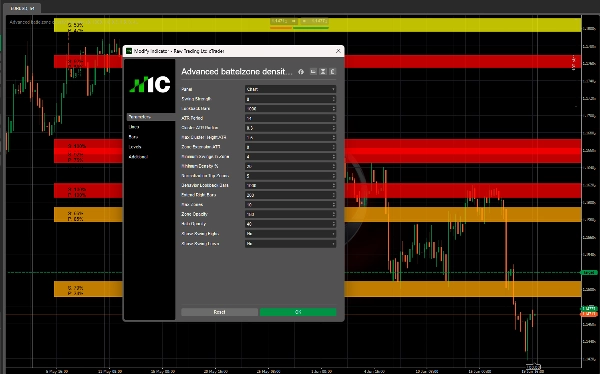
PARAMÈTRES CLÉS
- Force des oscillations : Sensibilité des pivots (plus élevé = moins d'oscillations)
- Barres de retour : Jusqu'où remonter pour détecter les oscillations
- Période ATR : Pour le calcul adaptatif du rayon
- Rayon ATR de regroupement : Distance maximale entre oscillations pour les regrouper
- Hauteur maximale du regroupement ATR : Rejette les zones plus larges que cela
- Extension de zone ATR : Taille du halo pour la détection des rejets
- Oscillations minimales dans la zone : Taille minimale du regroupement
- Score de chaleur minimum : Affiche uniquement les zones au-dessus de ce seuil
- Barres de retour comportementales : Période pour le suivi de l'engagement
- Nombre maximal de zones : Nombre maximum de zones affichées
- Opacité zone / halo : Transparence visuelle
--------------------------------------------------
CAS D'UTILISATION
- Trouver de véritables zones de chaleur structurelle (chaleur élevée + fort engagement)
- Distinguer les zones d'acceptation des zones de rejet
- Éviter les zones à faible chaleur et faible participation
- Identifier les regroupements structurels pour placer entrées et sorties
- Confluence avec des indicateurs de tendance ou le flux d'ordres
--------------------------------------------------
NOTES TECHNIQUES
- Indicateur en superposition (dessine sur le graphique des prix)
- Fonctionne sur n'importe quelle unité de temps et symbole
- S'adapte automatiquement à la volatilité via l'ATR
- Pas de repaint (les oscillations sont historiques)
--------------------------------------------------
DES CRÉATEURS DE INVICTUS EA
Structural Heat Zones partage la même technologie de participation structurelle que le système de trading automatisé Invictus.
--------------------------------------------------
AVERTISSEMENT SUR LES RISQUES
Cet indicateur est un outil analytique. Il ne génère pas de signaux de trading automatisés. Toutes les décisions de trading restent sous la responsabilité de l'utilisateur.
--------------------------------------------------
SUPPORT
Mises à jour à vie incluses.
POUR PLUS D'INFORMATIONS - Cliquez sur le profil du développeur ci-dessous.
Résumé
Key features include color-coded heat zones, halo extensions for rejection visualization, and data labels displaying heat, participation, acceptance, and rejection scores. The system measures candle touches, closes inside zones, and wick rejections over a configurable lookback period to quantify market engagement. Adjustable parameters allow customization of swing sensitivity, cluster radius, zone size, and visual opacity.
This tool supports any timeframe and symbol, adapts to volatility using ATR, and does not repaint historical swings. It is intended for identifying genuine structural heat zones, differentiating acceptance from rejection areas, and aiding entry and exit placement in conjunction with other trend or order flow indicators. The indicator is analytical and does not generate automated trading signals.
Avis clients
5 | 100 % | |
4 | 0 % | |
3 | 0 % | |
2 | 0 % | |
1 | 0 % |


![Logo de "[Stellar Strategies] Inside Bar with Signals"](https://cdn.ctrader.com/image/webp/1d9e8bfa-3b2c-4440-bb37-5856902008a7_30683)


