Descrição
Índice de Momentum Estocástico (SMI) é um oscilador estocástico refinado projetado para medir o momentum de forma mais suave do que um Estocástico clássico. Esta implementação do cTrader corresponde à formulação comumente usada no TradingView aplicando suavização dupla por EMA tanto ao intervalo relativo quanto ao intervalo alta–baixa, produzindo uma curva de momentum limpa e estável que funciona bem em condições de tendência e de faixa.
O que ele mostra
- O SMI mede onde o fechamento está em relação ao ponto médio do intervalo recente alta–baixa, normalizado e escalonado.
- Os valores tendem a oscilar entre -100 e +100.
- Níveis de referência de sobrecompra/sobrevenda (padrão +40 / -40) ajudam a identificar condições esticadas e extremos de momentum.
Gráficos
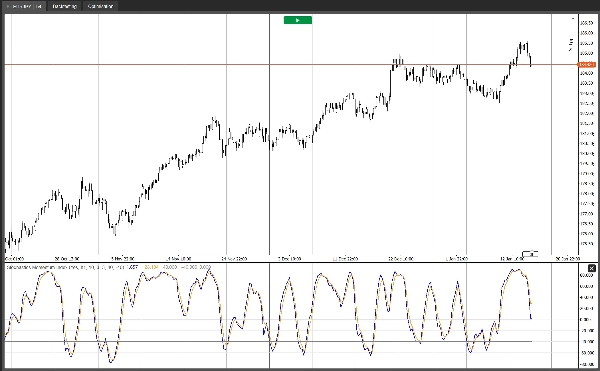
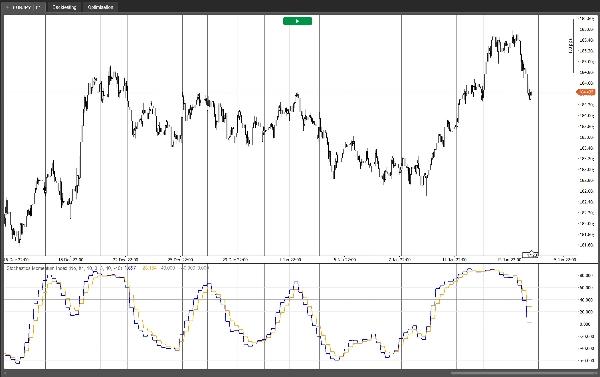
- SMI: a linha principal de momentum.
- EMA baseada no SMI: uma linha de sinal (EMA do SMI) para cruzamentos e confirmação.
- Níveis de Sobrecompra / Sobrevenda / Meio (0) para contexto visual rápido.
Como os traders o utilizam
- Regimes de tendência: Use a linha 0 como filtro direcional (acima de 0 = pressão de alta, abaixo de 0 = pressão de baixa) e negocie pullbacks via cruzamentos do SMI com a linha de sinal na direção da tendência.
- Regimes de reversão à média: Negocie contra extremos quando o SMI retorna de sobrecompra/sobrevenda e confirma com um cruzamento, frequentemente mirando a linha 0 como o primeiro objetivo de reversão à média.
- Divergências: Divergência de momentum entre preço e SMI pode destacar potenciais oscilações enfraquecidas.
Opção multi-temporal
- Selecione um Intervalo de Tempo Fonte para calcular o SMI a partir de um intervalo de tempo superior enquanto o exibe no gráfico atual (ideal para filtrar ruído e melhorar a qualidade do sinal).
- Ou ative Usar Intervalo de Tempo do Gráfico para manter os cálculos no intervalo de tempo atual.
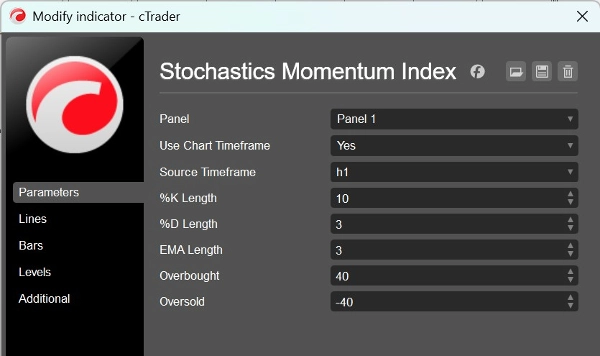
Entradas
- Comprimento %K: janela de retrocesso para a máxima máxima / mínima mínima.
- Comprimento %D: comprimento de suavização usado no cálculo da dupla EMA.
- Comprimento EMA: comprimento da linha de sinal (EMA do SMI).
- Sobrecompra / Sobrevenda: níveis de referência.
- Usar Intervalo de Tempo do Gráfico / Intervalo de Tempo Fonte: cálculo opcional em intervalo de tempo superior.
Este indicador foi construído para ser leve, estável e prático para fluxos de trabalho de negociação reais—seja para negociar continuação de tendência, faixas, ou usar o SMI como filtro de confirmação dentro de uma estratégia mais ampla.
Resumo
The indicator plots three key elements: the main SMI momentum line, an EMA-based signal line for crossovers and confirmation, and reference levels for overbought, oversold, and the zero midpoint. Traders use the zero line as a directional filter to identify bullish or bearish pressure and trade pullbacks via SMI and signal line crossovers. It also supports mean-reversion strategies by signaling fades from overbought/oversold conditions and can highlight momentum divergences.
A multi-timeframe option allows calculation of the SMI from a higher timeframe while displaying it on the current chart, helping to filter noise and improve signal quality. User inputs include lookback lengths for %K and %D, signal line EMA length, overbought/oversold levels, and timeframe selection. The indicator is designed for use across various markets including Forex, stocks, commodities, indices, and cryptocurrencies.
Avaliações de clientes
5 | 50 % | |
4 | 50 % | |
3 | 0 % | |
2 | 0 % | |
1 | 0 % |