

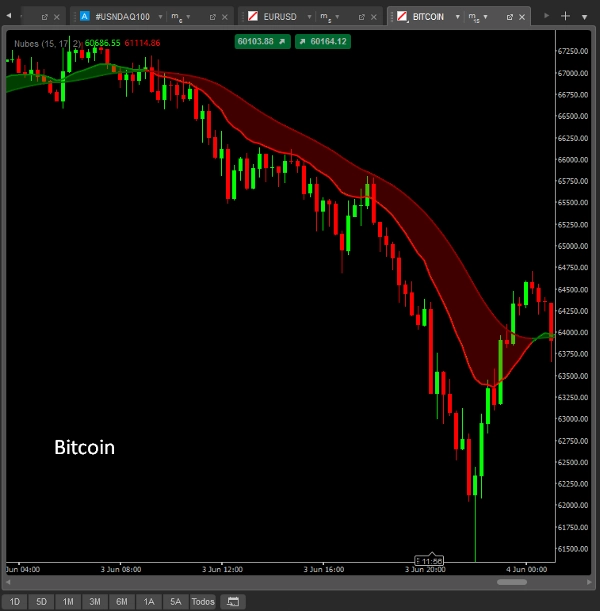
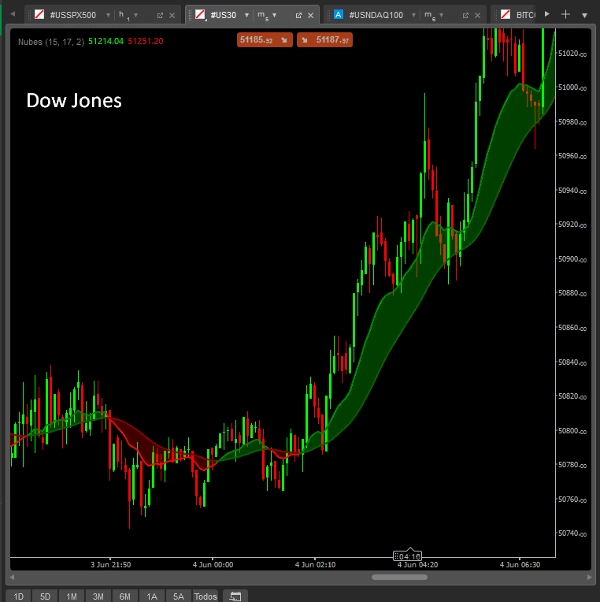
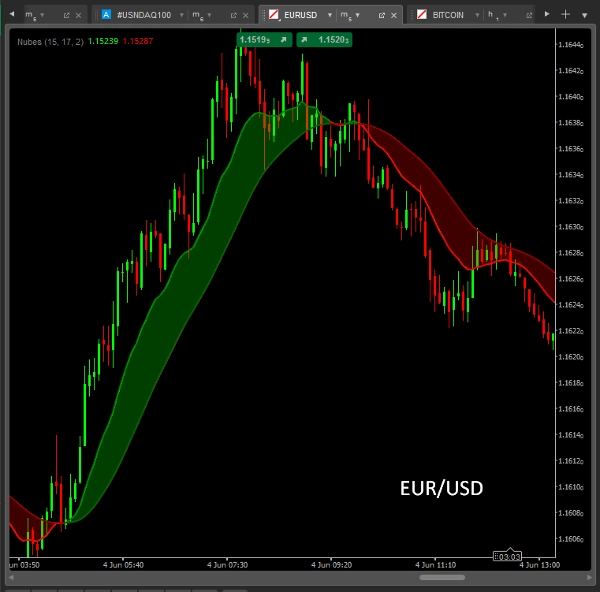
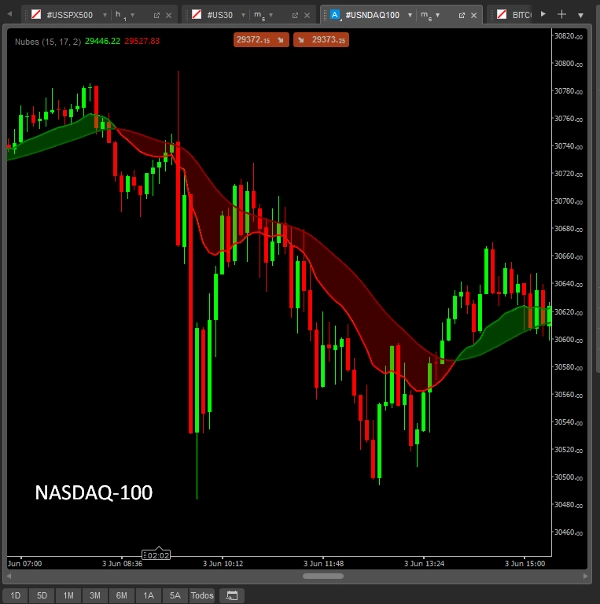
الوصف
مؤشر سحابة الاتجاه المتوسط المتحرك المزدوج لـ cTrader
حافظ على تداولك متماشياً مع الاتجاه المؤسسي. مؤشر سحابة الاتجاه المتوسط المتحرك المزدوج هو أداة بصرية متقدمة مصممة لتحديد اتجاه السوق الكلي واكتشاف مناطق ذات احتمالية عالية للارتداد أو الدخول في الاستمرار.
يقوم الخوارزم بحساب وإسقاط متوسطين متحركين في نفس الوقت (متوسط متحرك قياسي ومتوسط متحرك مملس). المساحة الديناميكية بين الخطين مملوءة بسحابة ذكية متغيرة اللون تزيل ضوضاء السوق وتوفر تأكيدات بصرية واضحة في الوقت الحقيقي.
معلمات الإدخال قابلة للتخصيص 100%
تحكم كامل في الصيغ الرياضية لتناسب استراتيجيتك الخاصة:
- فترة ونوع المتوسط المتحرك السريع: حدد الفترة وطريقة الحساب (بسيط، أسي، مملس، مرجح خطيًا، إلخ) للمتوسط المتحرك السريع.
- فترة ونوع المتوسط المتحرك البطيء: اضبط معلمات المتوسط المتحرك البطيء لتوسيع أو تضييق عمق السحابة.
- شفافية السحابة المخصصة: قم بتعديل الشفافية والألوان بسهولة (الأخضر للصعودي، الأحمر للهبوطي) لتتناسب تمامًا مع موضوع مساحة عمل cTrader الداكن أو الفاتح.
كيفية التداول مع سحابة الاتجاه
- مرشح الاتجاه (متابعة الاتجاه): عندما تكون السحابة خضراء، يكون الميل صعوديًا ويجب أن تعطي الأولوية لإعدادات الشراء. عندما تتحول السحابة إلى حمراء، يكون الميل هبوطيًا ويجب أن تركز على إعدادات البيع.
- مناطق الارتداد (الدخول المناطقية): تعمل السحابة الديناميكية كمنطقة دعم أو مقاومة عائمة. انتظر حتى يعيد السعر اختبار السحابة أو يدخلها دون كسرها؛ رفض منطقة السحابة هو إشارة التنفيذ الخاصة بك.
- مرشح التوحيد (الضغط): عندما تتقاطع المتوسطات المتحركة بشكل متكرر وتصبح السحابة رقيقة جدًا، يحذرك المؤشر من سوق مستقر أو متذبذب، مما يحميك من الاختراقات الكاذبة.
الملخص
AI summary
Nubes_CTrader is a dynamic dual moving average cloud indicator designed for the cTrader platform. It simultaneously calculates and displays two moving averages—a Standard MA and a Smoothed MA—creating a color-coded cloud that visually represents market trends and reduces noise. The cloud changes color to indicate bullish (green) or bearish (red) market bias, helping traders identify trend direction in real time.
Key features include fully customizable input parameters for both fast and slow moving averages, allowing users to select period lengths and calculation methods such as Simple, Exponential, Smoothed, or Linear Weighted. The cloud’s transparency and colors can also be adjusted to fit different workspace themes.
The indicator supports multiple trading functions: it acts as a trend filter by signaling buy or sell bias based on cloud color; it identifies pullback zones where price retests the cloud for potential entry points; and it detects consolidation phases when the cloud narrows, warning of ranging markets to avoid false breakouts.
Nubes_CTrader is applicable to any asset and provides visual trend analysis, crossover signals, and pullback entry zones, supporting trading decisions with clear, real-time visual confirmations.
Key features include fully customizable input parameters for both fast and slow moving averages, allowing users to select period lengths and calculation methods such as Simple, Exponential, Smoothed, or Linear Weighted. The cloud’s transparency and colors can also be adjusted to fit different workspace themes.
The indicator supports multiple trading functions: it acts as a trend filter by signaling buy or sell bias based on cloud color; it identifies pullback zones where price retests the cloud for potential entry points; and it detects consolidation phases when the cloud narrows, warning of ranging markets to avoid false breakouts.
Nubes_CTrader is applicable to any asset and provides visual trend analysis, crossover signals, and pullback entry zones, supporting trading decisions with clear, real-time visual confirmations.
ملف تعريف المؤشر
فئة المؤشر
الاتجاه
نوع المخرجات
التصور
الإشارات
متطلبات البيانات
أعمدة السعر فقط
الإشارات المدعومة
تقاطع
الانقطاع
قوة الاتجاه
لمس المستوى
تقييمات العملاء
0.0
التقييمات: 0
تقييمات العملاء
لا توجد تقييمات لهذا المنتج حتى الآن. هل جرَّبته بالفعل؟ كن أول من يخبر الآخرين!
مناقشة
الأسئلة الشائعة
EMA
Supertrend
AI-assisted
Supply & Demand
Moving Average
Support & Resistance
يتم توفير المنتجات المتاحة من خلال cTrader Store، بما في ذلك روبوتات التداول والمؤشرات والإضافات، من قبل مطوري الطرف الثالث وإتاحتها لأغراض الوصول المعلوماتي والفني فقط. cTrader Store ليس وسيطًا ولا يقدم نصائح استثمارية أو توصيات شخصية أو أي ضمان للأداء المستقبلي.
المزيد من هذا المؤلف


















السعر
منذ 10/03/2026
2
المبيعات